Avon 2012 Annual Report Download - page 13
Download and view the complete annual report
Please find page 13 of the 2012 Avon annual report below. You can navigate through the pages in the report by either clicking on the pages listed below, or by using the keyword search tool below to find specific information within the annual report.-
 1
1 -
2
-
 3
3 -
 4
4 -
 5
5 -
 6
6 -
 7
7 -
 8
8 -
 9
9 -
 10
10 -
 11
11 -
 12
12 -
 13
13 -
 14
14 -
 15
15 -
 16
16 -
 17
17 -
 18
18 -
 19
19 -
 20
20 -
 21
21 -
 22
22 -
 23
23 -
24
-
25
-
26
-
27
-
28
-
29
-
30
-
31
-
32
-
33
-
34
-
35
-
36
-
37
-
38
-
39
-
40
-
41
-
42
-
43
-
44
-
45
-
46
-
47
-
48
-
49
-
50
-
51
-
52
-
53
-
54
-
55
-
56
-
57
-
58
-
59
-
60
-
61
-
62
-
63
-
64
-
65
-
66
-
67
-
68
-
69
-
70
-
71
-
72
-
73
-
74
-
75
-
76
-
77
-
78
-
79
-
80
-
81
-
82
-
83
-
84
-
85
-
86
-
87
-
88
-
89
-
90
-
91
-
92
-
93
-
94
-
95
-
96
-
97
-
98
-
99
-
100
-
101
-
102
-
103
-
104
-
105
-
106
-
107
-
108
-
109
-
110
-
111
-
112
-
113
-
114
-
115
-
116
-
117
-
118
-
119
-
120
-
121
 |
 |

PART I
Packages, consisting of containers and packaging components, are designed by our staff of artists and designers. The design and
development of new Beauty products are affected by the cost and availability of materials such as glass, plastics and chemicals. We believe
that we can continue to obtain sufficient raw materials and supplies to manufacture and produce our Beauty products for the foreseeable
future.
We also continue to implement an enterprise resource planning (“ERP”) system on a worldwide basis, which is expected to improve the
efficiency of our supply chain and financial transaction processes. The implementation is expected to continue in phases over the next several
years. We have completed implementation in certain significant markets.
See Item 2, Properties, on pages 18 through 19 of our 2012 Annual Report for additional information regarding the location of our principal
manufacturing facilities.
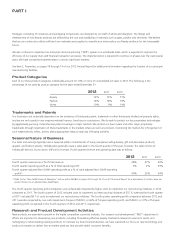
Product Categories
Each of our three product categories individually account for 10% or more of consolidated net sales in 2012. The following is the
percentage of net sales by product category for the years ended December 31:
2012 2011 2010
Beauty 72% 73% 71%
Fashion 18% 18% 19%
Home 10% 9% 10%
Trademarks and Patents
Our business is not materially dependent on the existence of third-party patent, trademark or other third-party intellectual property rights,
and we are not a party to any ongoing material licenses, franchises or concessions. We do seek to protect our key proprietary technologies
by aggressively pursuing comprehensive patent coverage in major markets. We protect our Avon name and other major proprietary
trademarks through registration of these trademarks in the markets where we sell our products, monitoring the markets for infringement of
such trademarks by others, and by taking appropriate steps to stop any infringing activities.
Seasonal Nature of Business
Our sales and earnings typically have a seasonal pattern characteristic of many companies selling beauty, gift and decorative products,
apparel, and fashion jewelry. Holiday sales generally cause a sales peak in the fourth quarter of the year; however, the sales volume of
holiday gift items is, by its nature, difficult to forecast. Fourth quarter revenue and operating data was as follows:
2012 2011 2010
Fourth quarter revenues as a % of total revenue 28% 27% 29%
Fourth quarter operating profit as a % of total operating profit 3% 2% 33%
Fourth quarter adjusted Non-GAAP operating profit as a % of total adjusted Non-GAAP operating
profit(1) 40% 25% 34%
(1) Refer to the “Non-GAAP Financial Measures” section within MD&A on pages 24 through 25 of our 2012 Annual Report for a description of certain items we
present herein on an adjusted Non-GAAP basis.
The fourth quarter operating profit comparison was unfavorably impacted by higher costs to implement our restructuring initiatives in 2012
compared to 2011. The fourth quarter of 2012 included costs to implement our restructuring initiatives of $57.6, whereas the fourth quarter
of 2011 included $8.7 of costs to implement our restructuring initiatives. The fourth quarter operating profit comparison between 2012 and
2011 was also impacted by non-cash impairment charges of $209.0, or 66% of full year operating profit, and $263.0, or 31% of full year
operating profit, recognized in the fourth quarters of 2012 and 2011, respectively.
Research and Product Development Activities
New products are essential to growth in the highly competitive cosmetics industry. Our research and development (“R&D”) department’s
efforts are important to developing new products, including formulating effective beauty treatments relevant to women’s needs, and
redesigning or reformulating existing products. To increase our brand competitiveness, we have sustained our focus on new technology and
product innovation to deliver first-to-market products that provide visible consumer benefits.