Avon 2012 Annual Report Download - page 36
Download and view the complete annual report
Please find page 36 of the 2012 Avon annual report below. You can navigate through the pages in the report by either clicking on the pages listed below, or by using the keyword search tool below to find specific information within the annual report.-
 1
1 -
2
-
3
-
4
-
5
-
6
-
7
-
8
-
9
-
10
-
11
-
12
-
13
-
14
-
15
-
16
-
17
-
18
-
19
-
20
-
21
-
22
-
23
-
24
-
25
-
 26
26 -
 27
27 -
 28
28 -
 29
29 -
 30
30 -
 31
31 -
 32
32 -
 33
33 -
 34
34 -
 35
35 -
 36
36 -
 37
37 -
 38
38 -
 39
39 -
 40
40 -
 41
41 -
 42
42 -
 43
43 -
 44
44 -
 45
45 -
 46
46 -
47
-
48
-
49
-
50
-
51
-
52
-
53
-
54
-
55
-
56
-
57
-
58
-
59
-
60
-
61
-
62
-
63
-
64
-
65
-
66
-
67
-
68
-
69
-
70
-
71
-
72
-
73
-
74
-
75
-
76
-
77
-
78
-
79
-
80
-
81
-
82
-
83
-
84
-
85
-
86
-
87
-
88
-
89
-
90
-
91
-
92
-
93
-
94
-
95
-
96
-
97
-
98
-
99
-
100
-
101
-
102
-
103
-
104
-
105
-
106
-
107
-
108
-
109
-
110
-
111
-
112
-
113
-
114
-
115
-
116
-
117
-
118
-
119
-
120
-
121
 |
 |

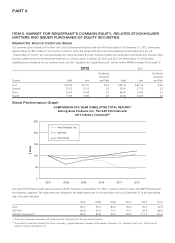
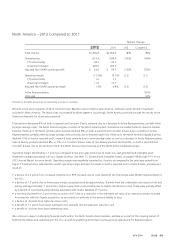
See Note 17, Goodwill and Intangible Assets, on pages F-48 through F-51 of our 2012 Annual Report for further information on Silpada and
China.
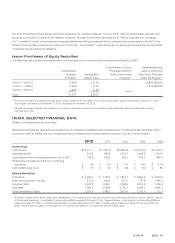
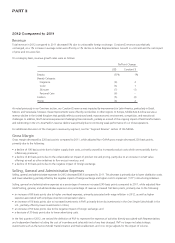
Results Of Continuing Operations - Consolidated
%/Point Change
2012 2011 2010
2012 vs.
2011
2011 vs.
2010
Total revenue $10,717.1 $11,291.6 $10,862.8 (5)% 4%
Cost of sales 4,169.3 4,148.6 4,041.3 –% 3%
Selling, general and administrative expenses 5,980.0 6,025.4 5,748.4 (1)% 5%
Impairment of goodwill and intangible asset 253.0 263.0 – (4)% *
Operating profit 314.8 854.6 1,073.1 (63)% (20)%
Interest expense 104.3 92.9 87.1 12% 7%
Interest income (15.1) (16.5) (14.0) (8)% 18%
Other expense, net 7.0 35.6 54.6 (80)% (35)%
Net (loss) income attributable to Avon (42.5) 513.6 606.3 (108)% (15)%
Diluted (loss) earnings per share attributable to Avon
$ (.10) $ 1.18 $ 1.39 (108)% (15)%
Advertising expenses(1) $ 253.6 $ 311.2 $ 400.4 (19)% (22)%
Gross margin 61.1% 63.3% 62.8% (2.2) .5
CTI restructuring –.1 .1 (.1) –
Venezuelan special items ––.6 –(.6)
Adjusted Non-GAAP gross margin 61.1% 63.4% 63.5% (2.3) (.1)
Selling, general and administrative expenses as a %
of total revenue 55.8% 53.4% 52.9% 2.4 .5
CTI restructuring (1.1) (.3) (.7) (.8) .4
Venezuelan special items – – (.1) – .1
Adjusted Non-GAAP selling, general and
administrative expenses as a % of total revenue 54.7% 53.1% 52.2% 1.6 .9
Operating profit $ 314.8 $ 854.6 $ 1,073.1 (63)% (20)%
CTI restructuring 124.7 40.0 80.7
Impairment charges 253.0 263.0 –
Venezuelan special items – – 79.5
Adjusted Non-GAAP operating profit $ 692.5 $ 1,157.6 $ 1,233.3 (40)% (6)%
Operating margin 2.9% 7.6% 9.9% (4.7) (2.3)
CTI restructuring 1.2 .4 .7 .8 (.3)
Impairment charges 2.4 2.3 – .1 2.3
Venezuelan special items – – .7 – (.7)
Adjusted Non-GAAP operating margin 6.5% 10.3% 11.4% (3.8) (1.1)
Effective tax rate 117.5% 29.1% 37.0% 88.4 (7.9)
CTI restructuring (.3) .1 .3 (.4) (.2)
Impairment charges (5.5) 2.0 – (7.5) 2.0
Venezuelan special items .1 – (5.6) (.1) 5.6
Special tax items (77.0) – – (77.0) –
Adjusted Non-GAAP effective tax rate 34.8% 31.3% 31.8% 3.5 (.5)
Active Representatives (1)% (1)%
Units sold –% (2)%
Amounts in the table above may not necessarily sum due to rounding.
* Calculation not meaningful
(1) Advertising expenses are included within selling, general and administrative expenses.
A V O N 2012 29