Avon 2012 Annual Report Download - page 42
Download and view the complete annual report
Please find page 42 of the 2012 Avon annual report below. You can navigate through the pages in the report by either clicking on the pages listed below, or by using the keyword search tool below to find specific information within the annual report.-
 1
1 -
2
-
3
-
4
-
5
-
6
-
7
-
8
-
9
-
10
-
11
-
12
-
13
-
14
-
15
-
16
-
17
-
18
-
19
-
20
-
21
-
22
-
23
-
24
-
25
-
26
-
27
-
28
-
29
-
30
-
31
-
 32
32 -
 33
33 -
 34
34 -
 35
35 -
 36
36 -
 37
37 -
 38
38 -
 39
39 -
 40
40 -
 41
41 -
 42
42 -
 43
43 -
 44
44 -
 45
45 -
 46
46 -
 47
47 -
 48
48 -
 49
49 -
 50
50 -
 51
51 -
 52
52 -
53
-
54
-
55
-
56
-
57
-
58
-
59
-
60
-
61
-
62
-
63
-
64
-
65
-
66
-
67
-
68
-
69
-
70
-
71
-
72
-
73
-
74
-
75
-
76
-
77
-
78
-
79
-
80
-
81
-
82
-
83
-
84
-
85
-
86
-
87
-
88
-
89
-
90
-
91
-
92
-
93
-
94
-
95
-
96
-
97
-
98
-
99
-
100
-
101
-
102
-
103
-
104
-
105
-
106
-
107
-
108
-
109
-
110
-
111
-
112
-
113
-
114
-
115
-
116
-
117
-
118
-
119
-
120
-
121
 |
 |
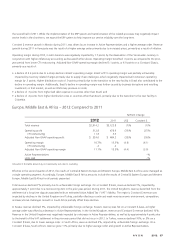
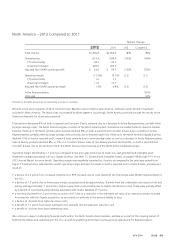
Constant $ revenue growth in Brazil was driven by an increase in Active Representatives. Revenue growth in Brazil was negatively impacted
by decreased demand, which was partially due to increased competition, as well as uncompetitive pricing in Fashion and Home during the
first half of 2012. Brazil’s sales of Beauty products declined 11% and sales of non-Beauty products declined 15%, both negatively impacted
by foreign exchange. On a Constant $ basis, Brazil’s sales of Beauty products increased 4% and sales of non-Beauty were flat.
Constant $ revenue growth in Mexico was driven by an increase in Active Representatives, as well as higher average order. Revenue growth
in Venezuela was primarily due to higher average order, benefiting from the inflationary impact on pricing; however, Venezuela revenue
growth was restrained during the latter half of 2012 by slowing economic activity and the impact of lower inflation on pricing. Revenue and
operating profit in Venezuela will be negatively impacted in future periods by the change in the official exchange rate discussed below.
Additional information on our Venezuela operations is discussed in more detail below.
Operating margin was negatively impacted by .3 points as compared to the prior-year period from higher CTI restructuring. Adjusted Non-
GAAP operating margin declined 3.0 points, or 2.6 points on a Constant $ basis, primarily as a result of:
• a decline of 2.5 points due to lower gross margin caused primarily by .9 points from higher supply chain costs not offset by pricing. Gross
margin was also negatively impacted by .9 points from foreign exchange and .7 points from the unfavorable net impact of pricing and
mix;
• a decline of .8 points from increased overhead, primarily due to wage inflation outpacing revenue growth;
• a benefit of .4 points from lower bad debt expense; and
• a benefit of .3 points from lower advertising costs.
Effective January 1, 2010, we began to account for Venezuela as a highly inflationary economy. Effective January 11, 2010, the Venezuelan
government devalued its currency and moved to a two-tier exchange structure. The official exchange rate moved from 2.15 to 2.60 for
essential goods and to 4.30 for nonessential goods and services. Effective December 30, 2010, the Venezuelan government eliminated the
2.60 rate which had been available for the import of essential goods. Substantially all of the imports of our subsidiary in Venezuela (“Avon
Venezuela”) were classified as nonessential.
As a result of the change in the official rate to 4.30 in conjunction with accounting for our operations in Venezuela under highly inflationary
accounting guidelines, during the first quarter of 2010, we recorded net charges of $46.1 in “Other expense, net” and $12.7 in “Income
taxes”, for a total after-tax charge of $58.8, reflecting the write-down of monetary assets and liabilities and deferred tax benefits.
Additionally, certain nonmonetary assets must continue to be carried at U.S. historic dollar cost subsequent to the devaluation. Therefore,
the historic U.S. dollar costs impacted the income statement during 2010 at a disproportionate rate as they had not been devalued based on
the new exchange rates. As a result of using the U.S. historic dollar cost basis of nonmonetary assets, such as inventory, acquired prior to the
devaluation, operating profit during 2010 was negatively impacted by $79.5, for the difference between the historical cost at the previous
official exchange rate of 2.15 and the current official exchange rate of 4.30. As there were no further devaluations during 2012 and 2011,
there was an immaterial impact on operating profit in 2012 and 2011 from the 2010 Venezuelan currency devaluations.
Currency restrictions enacted by the Venezuelan government in 2003 have impacted the ability of Avon Venezuela to obtain foreign
currency at the official rate to pay for imported products. Since 2003, Avon Venezuela had been obtaining its foreign currency needs beyond
the amounts that could be obtained at official rates through non-government sources where the exchange rates were less favorable than
the official rate (“parallel market”). In late May 2010, the Venezuelan government took control over the previously freely-traded parallel
market. Trading in the parallel market was suspended for several weeks in May and June and reopened as a regulated (“SITME”) market in
early June 2010. The government has imposed volume restrictions on trading activity, limiting an entity’s activity to a maximum of $0.35 per
month. The current limit is below the monthly foreign exchange requirements of our Venezuelan operations and, unless these restrictions
are modified, may have a negative impact on Avon Venezuela’s future operations. There is no assurance that the Company will be able to
recover the higher cost of obtaining foreign currency in the SITME market as compared to the official rate through operating activities, such
as increased pricing or cost reductions in other areas. Refer to the “Results Of Continuing Operations – Consolidated” section of this MD&A
for discussion of the release of a provision of approximately $24 in the fourth quarter of 2012 for the difference between the regulated
SITME rate and the official exchange rate, associated with the capitalization of intercompany liabilities.
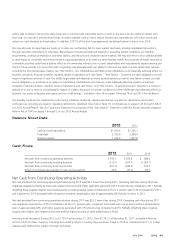
We account for Venezuela as a highly inflationary economy. At December 31, 2012 we had a net asset position of $371 associated with our
operations in Venezuela, which included cash balances of approximately $173 of which approximately $171 was denominated in Bolívares
remeasured at the December 31, 2012 official exchange rate and approximately $2 was denominated in U.S. dollars. Of the $371 net asset
A V O N 2012 35