Avon 2012 Annual Report Download - page 38
Download and view the complete annual report
Please find page 38 of the 2012 Avon annual report below. You can navigate through the pages in the report by either clicking on the pages listed below, or by using the keyword search tool below to find specific information within the annual report.-
 1
1 -
2
-
3
-
4
-
5
-
6
-
7
-
8
-
9
-
10
-
11
-
12
-
13
-
14
-
15
-
16
-
17
-
18
-
19
-
20
-
21
-
22
-
23
-
24
-
25
-
26
-
27
-
 28
28 -
 29
29 -
 30
30 -
 31
31 -
 32
32 -
 33
33 -
 34
34 -
 35
35 -
 36
36 -
 37
37 -
 38
38 -
 39
39 -
 40
40 -
 41
41 -
 42
42 -
 43
43 -
 44
44 -
 45
45 -
 46
46 -
 47
47 -
 48
48 -
49
-
50
-
51
-
52
-
53
-
54
-
55
-
56
-
57
-
58
-
59
-
60
-
61
-
62
-
63
-
64
-
65
-
66
-
67
-
68
-
69
-
70
-
71
-
72
-
73
-
74
-
75
-
76
-
77
-
78
-
79
-
80
-
81
-
82
-
83
-
84
-
85
-
86
-
87
-
88
-
89
-
90
-
91
-
92
-
93
-
94
-
95
-
96
-
97
-
98
-
99
-
100
-
101
-
102
-
103
-
104
-
105
-
106
-
107
-
108
-
109
-
110
-
111
-
112
-
113
-
114
-
115
-
116
-
117
-
118
-
119
-
120
-
121
 |
 |

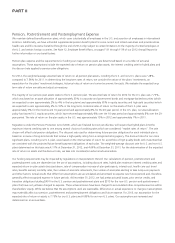
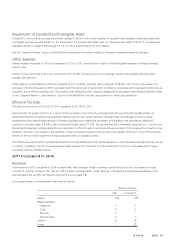
Impairment of Goodwill and Intangible Asset
During 2012 we recorded non-cash impairment charges of $209.0 in the fourth quarter for goodwill and intangible assets associated with
our Silpada business, as well as $44.0 in the third quarter for goodwill associated with our China business. Refer to Note 17, Goodwill and
Intangible Assets, on pages F-48 through F-51 of our 2012 Annual Report for more details.
See the “Segment Review” section of this MD&A for additional information related to changes in operating margin by segment.
Other Expense
Interest expense increased in 2012 as compared to 2011 by 12%, primarily due to higher outstanding debt balances and higher average
interest rates.
Interest income decreased in 2012 as compared to 2011 by 8%, primarily due to lower average interest rates partially offset by higher
average cash balances.
Other expense, net decreased in 2012 as compared to 2011 by 80%, primarily due to a benefit of $23.8 in 2012 due to the release of a
provision in the fourth quarter of 2012 associated with the excess cost of acquiring U.S. dollars in Venezuela at the regulated market rate as
compared to the official exchange rate. This provision was released as the Company capitalized the associated intercompany liabilities. Refer
to the “Segment Review – Latin America” section of this MD&A for a further discussion of our Venezuela operations.
Effective Tax Rate
The effective tax rate for 2012 was 117.5%, compared to 29.1% for 2011.
During the fourth quarter of 2012, as a result of the uncertainty of our financing arrangements and our domestic liquidity profile, we
determined that the Company may repatriate offshore cash to meet certain domestic funding needs. Accordingly, we are no longer
asserting that the undistributed earnings of foreign subsidiaries are indefinitely reinvested, and therefore, we recorded an additional
provision for income taxes of $168.3, which impacted the tax rate by 77.0%. The tax rate was also unfavorably impacted by 7.1 points from
the goodwill impairment charge related to our operations in China for which no tax benefit was recorded. This charge will not result in a tax
deduction as there is no tax basis in this goodwill. These unfavorable impacts to the tax rate were partially offset by 1.6 points from the tax
benefit on the non-cash impairment charge associated with our Silpada business.
The effective tax rate for 2011 included tax benefits from audit settlements and statute expirations, which favorably impacted the tax rate by
3.1 points. In addition, the 2011 tax rate was favorably impacted by 2.0 points from the tax benefit on the non-cash impairment charge
associated with our Silpada business.
2011 Compared to 2010
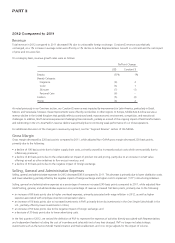
Revenue
Total revenue in 2011 compared to 2010 increased 4%, with favorable foreign exchange contributing 3 points to the revenue increase.
Constant $ revenues increased 1%, due to a 2% increase in average order, partly offset by a 1% decline in Active Representatives. Units
sold decreased 2% and the net impact of price and mix increased 3%.
On a category basis, revenue growth rates were as follows:
%/Point Change
US$ Constant $
Beauty 5% 2%
Beauty Category:
Fragrance 7 5
Color 5 2
Skincare 3 –
Personal Care 4 1
Fashion (1) (3)
Home 1 (2)
A V O N 2012 31