Avon 2012 Annual Report Download - page 50
Download and view the complete annual report
Please find page 50 of the 2012 Avon annual report below. You can navigate through the pages in the report by either clicking on the pages listed below, or by using the keyword search tool below to find specific information within the annual report.-
 1
1 -
2
-
3
-
4
-
5
-
6
-
7
-
8
-
9
-
10
-
11
-
12
-
13
-
14
-
15
-
16
-
17
-
18
-
19
-
20
-
21
-
22
-
23
-
24
-
25
-
26
-
27
-
28
-
29
-
30
-
31
-
32
-
33
-
34
-
35
-
36
-
37
-
38
-
39
-
 40
40 -
 41
41 -
 42
42 -
 43
43 -
 44
44 -
 45
45 -
 46
46 -
 47
47 -
 48
48 -
 49
49 -
 50
50 -
 51
51 -
 52
52 -
 53
53 -
 54
54 -
 55
55 -
 56
56 -
 57
57 -
 58
58 -
 59
59 -
 60
60 -
61
-
62
-
63
-
64
-
65
-
66
-
67
-
68
-
69
-
70
-
71
-
72
-
73
-
74
-
75
-
76
-
77
-
78
-
79
-
80
-
81
-
82
-
83
-
84
-
85
-
86
-
87
-
88
-
89
-
90
-
91
-
92
-
93
-
94
-
95
-
96
-
97
-
98
-
99
-
100
-
101
-
102
-
103
-
104
-
105
-
106
-
107
-
108
-
109
-
110
-
111
-
112
-
113
-
114
-
115
-
116
-
117
-
118
-
119
-
120
-
121
 |
 |

will be able to obtain financing for these purposes on commercially reasonable terms or at all. In the event we are unable to obtain such
financing, we may elect, among other things, to utilize available cash on hand, reduce discretionary expenditures, sell certain assets and
reduce our cash dividend to shareholders. In addition, $137.5 of the term loan agreement (as defined below) is due in June 2014.
We may also seek to repurchase our equity or to retire our outstanding debt in open market purchases, privately negotiated transactions,
through derivative instruments or otherwise. Repurchases of equity and debt will depend on prevailing market conditions, our liquidity
requirements, contractual restrictions and other factors, and the amounts involved may be material. We may also elect to incur additional debt
or issue equity or convertible securities to finance ongoing operations or to meet our other liquidity needs. Any issuances of equity securities or
convertible securities could have a dilutive effect on the ownership interest of our current shareholders and may adversely impact earnings per
share in future periods. For more information regarding risks associated with our ability to refinance our debt or access certain debt markets,
including the commercial paper market, see “Risk Factors – Our indebtedness and debt service obligations could materially adversely affect our
business, prospects, financial condition, liquidity, results of operations and cash flows,” “Risk Factors – To service our debt obligations, we will
require a significant amount of cash. Our ability to generate cash depends on many factors beyond our control. Any failure to meet our debt
service obligations, or to refinance or repay our outstanding indebtedness as it matures, could materially adversely impact our business,
prospects, financial condition, liquidity, results of operations and cash flows,” and “Risk Factors – A general economic downturn, a recession
globally or in one or more of our geographic regions or sudden disruption in business conditions or other challenges may adversely affect our
business, our access to liquidity and capital, and our credit ratings,” included in Item 1A on pages 7 through 18 of our 2012 Annual Report.
Our liquidity could also be impacted by restructuring initiatives, dividends, capital expenditures, acquisitions, divestitures, and certain
contingencies, including any legal or regulatory settlements, described more fully in Note 16, Contingencies on pages F-46 through F-48 of
our 2012 Annual Report. See our Cautionary Statement for purposes of the “Safe Harbor” Statement under the Private Securities Litigation
Reform Act of 1995 on pages 1 through 2 of our 2012 Annual Report.
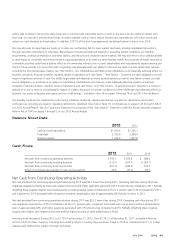
Balance Sheet Data
2012 2011
Cash and cash equivalents $1,209.6 $1,245.1
Total debt 3,195.9 3,308.4
Working capital 1,224.3 1,207.8
Cash Flows
2012 2011 2010
Net cash from continuing operating activities $ 556.1 $ 655.8 $ 689.0
Net cash from continuing investing activities (213.7) (267.7) (1,095.7)
Net cash from continuing financing activities (401.3) (284.5) 234.7
Effect of exchange rate changes on cash and equivalents 23.4 (37.2) (33.7)
Net Cash from Continuing Operating Activities
Net cash provided from continuing operating activities during 2012 was $99.7 lower than during 2011. Operating cash flow during 2012 was
negatively impacted primarily by lower cash related net income and higher payments associated with CTI restructuring compared to 2011. Partially
offsetting these negative impacts were improvements in working capital, lower contributions to the U.S. pension plan in 2012 compared to 2011,
and a payment in 2011 associated with a long-term incentive compensation plan of approximately $36 that did not recur in 2012.
Net cash provided from continuing operating activities during 2011 was $33.2 lower than during 2010. Operating cash flow during 2011
was negatively impacted by a $75.0 contribution to the U.S. pension plan, a payment associated with a long-term incentive compensation
plan of approximately $36, and higher payments associated with CTI restructuring compared to 2010. Partially offsetting these negative
impacts were higher cash related net income and the higher recovery of value added taxes in Brazil.
Inventory levels decreased during 2012, to $1,135.4 at December 31, 2012, from $1,161.3 at December 31, 2011, primarily reflecting
actions in 2012 to flow inventory, including discounted products. Inventory days are down 3 days in 2012 as compared to 2011, or 9 days
operationally (without the impact of foreign exchange).
A V O N 2012 43