Avon 2012 Annual Report Download - page 77
Download and view the complete annual report
Please find page 77 of the 2012 Avon annual report below. You can navigate through the pages in the report by either clicking on the pages listed below, or by using the keyword search tool below to find specific information within the annual report.-
 1
1 -
2
-
3
-
4
-
5
-
6
-
7
-
8
-
9
-
10
-
11
-
12
-
13
-
14
-
15
-
16
-
17
-
18
-
19
-
20
-
21
-
22
-
23
-
24
-
25
-
26
-
27
-
28
-
29
-
30
-
31
-
32
-
33
-
34
-
35
-
36
-
37
-
38
-
39
-
40
-
41
-
42
-
43
-
44
-
45
-
46
-
47
-
48
-
49
-
50
-
51
-
52
-
53
-
54
-
55
-
56
-
57
-
58
-
59
-
60
-
61
-
62
-
63
-
64
-
65
-
66
-
 67
67 -
 68
68 -
 69
69 -
 70
70 -
 71
71 -
 72
72 -
 73
73 -
 74
74 -
 75
75 -
 76
76 -
 77
77 -
 78
78 -
 79
79 -
 80
80 -
 81
81 -
 82
82 -
 83
83 -
 84
84 -
 85
85 -
 86
86 -
 87
87 -
88
-
89
-
90
-
91
-
92
-
93
-
94
-
95
-
96
-
97
-
98
-
99
-
100
-
101
-
102
-
103
-
104
-
105
-
106
-
107
-
108
-
109
-
110
-
111
-
112
-
113
-
114
-
115
-
116
-
117
-
118
-
119
-
120
-
121
 |
 |
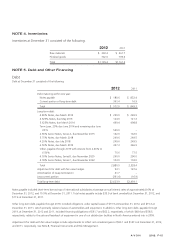
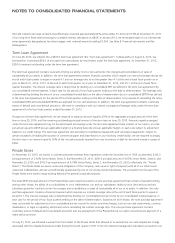
NOTES TO CONSOLIDATED FINANCIAL STATEMENTS
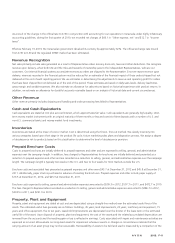
Research and Development
Research and development costs are expensed as incurred and amounted to $75.2 in 2012, $77.7 in 2011 and $72.6 in 2010. Research and
development costs include all costs related to the design and development of new products such as salaries and benefits, supplies and
materials and facilities costs.
Share-based Compensation
All share-based payments to employees are recognized in the financial statements based on their fair value using an option-pricing model at
the date of grant. We use a Black-Scholes-Merton option-pricing model to calculate the fair value of options.
Restructuring Reserves
We record the estimated expense for our restructuring initiatives when such costs are deemed probable and estimable, when approved by
the appropriate corporate authority and by accumulating detailed estimates of costs for such plans. These expenses include the estimated
costs of employee severance and related benefits, impairment or accelerated depreciation of property, plant and equipment, and any other
qualifying exit costs. Such costs represent our best estimate, but require assumptions about the programs that may change over time,
including attrition rates. Estimates are evaluated periodically to determine whether an adjustment is required.
Pension and Postretirement Expense
Pension and postretirement expense is determined based on a number of actuarial assumptions, which are reviewed and determined on an
annual basis. These assumptions include discount rates, hybrid plan maximum interest crediting rates and expected return on plan assets,
rate of compensation increase of plan participants, interest cost, health care cost trend rates, benefits earned, mortality rates, the number of
associate retirements, the number of associates electing to take lump-sum payments and other factors. Actual results that differ from
assumptions are accumulated and amortized to expense over future periods and, therefore, generally affect recognized expense in future
periods. We are required, among other things, to recognize the funded status of pension and other postretirement benefit plans on the
balance sheet. Each overfunded plan is recognized as an asset and each underfunded plan is recognized as a liability. The recognition of
prior service costs or credits and net actuarial gains or losses, as well as subsequent changes in the funded status, are recognized as
components of accumulated other comprehensive income, net of tax, in shareholders’ equity, until they are amortized as a component of
net periodic benefit cost. We recognize prior service costs or credits and actuarial gains and losses beyond a 10% corridor to earnings based
on the estimated future service period of the participants. The determination of the 10% corridor utilizes a calculated value of plan assets for
our more significant plans, whereby gains and losses are smoothed over three- and five-year periods. We use a December 31 measurement
date for all of our employee benefit plans.
Contingencies
We determine whether to disclose and/or accrue for loss contingencies based on an assessment of whether the risk of loss is remote,
reasonably possible or probable. We record loss contingencies when it is probable that a liability has been incurred and the amount of loss is
reasonably estimable.
Out-of-Period Items
During the first quarter of 2012, we recorded an out-of-period adjustment which decreased earnings by approximately $14 before tax ($10
after tax) which related to 2011 and was associated with bad debt expense in our South Africa operations. We evaluated the total out-of-
period adjustments impacting 2012 of approximately $13 before tax ($15 after tax), both individually and in the aggregate, in relation to the
quarterly and annual periods in which they originated and the annual period in which they were corrected, and concluded that these
adjustments were not material to the consolidated annual financial statements for all impacted periods.
During the first quarter of 2011, we determined that the net after-tax gain on sale of Avon Products Company Limited (“Avon Japan”),
reported in our financial statements for the year ended December 31, 2010, should have been reported as a net after-tax loss of
approximately $3, to correctly include all balances relating to Avon Japan that were previously included in AOCI. In addition, in the first
quarter of 2011 the Company released a liability relating to a previously owned health care business, which should have been released in a
prior period, resulting in an approximate $4 increase in net income. The results of these businesses were originally reported within
discontinued operations upon disposition. The net impact of these two items decreased net income for the first quarter of 2011 by
approximately $9. We also identified and recorded other various out-of- period adjustments during 2011 (primarily related to cost of sales
and selling, general and administrative expenses) that related to prior years. The net impact of these other items decreased net income for