Avon 2012 Annual Report Download - page 105
Download and view the complete annual report
Please find page 105 of the 2012 Avon annual report below. You can navigate through the pages in the report by either clicking on the pages listed below, or by using the keyword search tool below to find specific information within the annual report.-
 1
1 -
2
-
3
-
4
-
5
-
6
-
7
-
8
-
9
-
10
-
11
-
12
-
13
-
14
-
15
-
16
-
17
-
18
-
19
-
20
-
21
-
22
-
23
-
24
-
25
-
26
-
27
-
28
-
29
-
30
-
31
-
32
-
33
-
34
-
35
-
36
-
37
-
38
-
39
-
40
-
41
-
42
-
43
-
44
-
45
-
46
-
47
-
48
-
49
-
50
-
51
-
52
-
53
-
54
-
55
-
56
-
57
-
58
-
59
-
60
-
61
-
62
-
63
-
64
-
65
-
66
-
67
-
68
-
69
-
70
-
71
-
72
-
73
-
74
-
75
-
76
-
77
-
78
-
79
-
80
-
81
-
82
-
83
-
84
-
85
-
86
-
87
-
88
-
89
-
90
-
91
-
92
-
93
-
94
-
 95
95 -
 96
96 -
 97
97 -
 98
98 -
 99
99 -
 100
100 -
 101
101 -
 102
102 -
 103
103 -
 104
104 -
 105
105 -
 106
106 -
 107
107 -
 108
108 -
 109
109 -
 110
110 -
 111
111 -
 112
112 -
 113
113 -
 114
114 -
 115
115 -
116
-
117
-
118
-
119
-
120
-
121
 |
 |

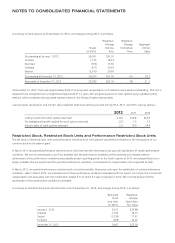
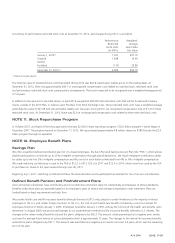
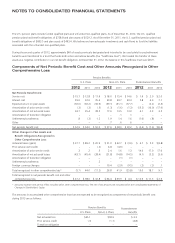
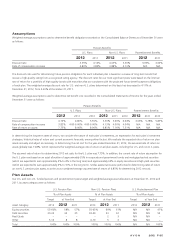
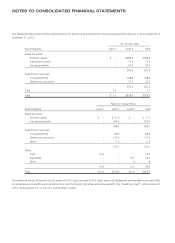
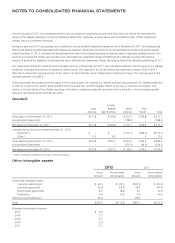
NOTES TO CONSOLIDATED FINANCIAL STATEMENTS
Global and other expenses include, among other things, costs related to our executive and administrative offices, information technology,
research and development, marketing and professional and related fees associated with the Foreign Corrupt Practices Act (“FCPA”)
investigations and compliance reviews. We allocate certain planned global expenses to our business segments primarily based on planned
revenue. The unallocated costs remain as Global and other expenses. We do not allocate to our segments costs of implementing
restructuring initiatives related to our global functions or professional and related fees associated with the FCPA investigations and
compliance reviews. Costs of implementing restructuring initiatives related to a specific segment are recorded within that segment.
The accounting policies of the segments are the same as those described in Note 1, Description of the Business and Summary of Significant
Accounting Policies. We evaluate the performance of our segments based on revenues and operating profits or losses. Segment revenues
primarily reflect direct sales of products to Representatives based on the Representative’s geographic location. Intersegment sales and
transfers are not significant. Each segment records direct expenses related to its employees and its operations.
Summarized financial information concerning our reportable segments as of December 31 is shown in the following tables:
Total Revenue & Operating Profit (Loss)
2012 2011 2010
Total
Revenue
Operating
Profit (Loss)
Total
Revenue
Operating
Profit (Loss)
Total
Revenue
Operating
Profit
Latin America $ 4,993.7 $ 443.9 $ 5,161.8 $ 634.0 $ 4,640.0 $ 613.3
Europe, Middle East & Africa 2,914.2 312.8 3,122.8 478.9 3,047.9 474.3
North America 1,906.8 (214.9) 2,064.6 (188.0) 2,193.5 147.3
Asia Pacific 902.4 5.1 942.4 81.4 981.4 82.6
Total from operations 10,717.1 546.9 11,291.6 1,006.3 10,862.8 1,317.5
Global and other – (232.1) – (151.7) – (244.4)
Total $10,717.1 $ 314.8 $11,291.6 $ 854.6 $10,862.8 $1,073.1
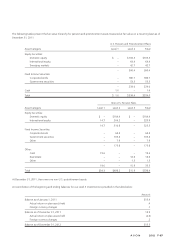
Total Assets
2012 2011 2010
Latin America $2,713.3 $2,766.4 $2,778.6
Europe, Middle East & Africa 1,380.2 1,516.2 1,601.2
North America 969.4 1,185.7 1,457.0
Asia Pacific 537.7 628.8 630.6
Total from operations 5,600.6 6,097.1 6,467.4
Global and other 1,781.9 1,637.9 1,406.3
Total assets $7,382.5 $7,735.0 $7,873.7
Capital Expenditures
2012 2011 2010
Latin America $ 99.0 $117.1 $200.5
Europe, Middle East & Africa 27.1 51.2 54.6
North America 8.9 12.5 18.5
Asia Pacific 4.6 16.0 18.9
Total from operations 139.6 196.8 292.5
Global and other 89.2 79.9 38.7
Total capital expenditures $ 228.8 $276.7 $331.2