Avon 2012 Annual Report Download - page 41
Download and view the complete annual report
Please find page 41 of the 2012 Avon annual report below. You can navigate through the pages in the report by either clicking on the pages listed below, or by using the keyword search tool below to find specific information within the annual report.-
 1
1 -
2
-
3
-
4
-
5
-
6
-
7
-
8
-
9
-
10
-
11
-
12
-
13
-
14
-
15
-
16
-
17
-
18
-
19
-
20
-
21
-
22
-
23
-
24
-
25
-
26
-
27
-
28
-
29
-
30
-
 31
31 -
 32
32 -
 33
33 -
 34
34 -
 35
35 -
 36
36 -
 37
37 -
 38
38 -
 39
39 -
 40
40 -
 41
41 -
 42
42 -
 43
43 -
 44
44 -
 45
45 -
 46
46 -
 47
47 -
 48
48 -
 49
49 -
 50
50 -
 51
51 -
52
-
53
-
54
-
55
-
56
-
57
-
58
-
59
-
60
-
61
-
62
-
63
-
64
-
65
-
66
-
67
-
68
-
69
-
70
-
71
-
72
-
73
-
74
-
75
-
76
-
77
-
78
-
79
-
80
-
81
-
82
-
83
-
84
-
85
-
86
-
87
-
88
-
89
-
90
-
91
-
92
-
93
-
94
-
95
-
96
-
97
-
98
-
99
-
100
-
101
-
102
-
103
-
104
-
105
-
106
-
107
-
108
-
109
-
110
-
111
-
112
-
113
-
114
-
115
-
116
-
117
-
118
-
119
-
120
-
121
 |
 |

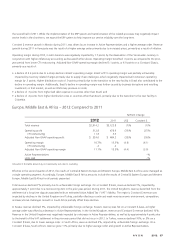
PART II
2012 Compared to 2011
Total global expenses increased primarily due to higher costs to implement restructuring initiatives, higher expenses associated with
employee incentive compensation plans, and higher expenses associated with global initiatives, and were partially offset by lower marketing
costs. Amounts allocated to segments decreased primarily due to the decrease in budgeted marketing and global sales costs, which are costs
that are allocated to segments. Professional and related fees associated with the FCPA investigations and compliance reviews described in
Note 16, Contingencies on pages F-46 through F-48 of our 2012 Annual Report, amounted to approximately $92.4, as compared to
approximately $93.3 in 2011. While these fees are difficult to predict, we expect ongoing fees may vary during the course of these
investigations and reviews. These fees were not allocated to the segments. Please see Risk Factors on page 12 of our 2012 Annual Report,
and Note 16, Contingencies on pages F-46 through F-48 of our 2012 Annual Report for more information regarding the FCPA
investigations, compliance reviews, and other related matters, including our expectations with respect to future professional and related fees
related to the FCPA investigations and compliance reviews.
2011 Compared to 2010
Total global expenses declined primarily due to lower expenses associated with management incentive programs, lower professional fees
associated with acquisitions and divestitures, and lower costs to implement restructuring initiatives. Amounts allocated to segments
increased in 2011 primarily due to an increase in costs associated with initiatives more specifically benefiting the segments as compared to
global initiatives. Professional and related fees associated with the FCPA investigations and compliance reviews described in Note 16,
Contingencies on pages F-46 through F-48 of our 2012 Annual Report, amounted to approximately $93.3 in 2011, as compared to
approximately $95.3 in 2010. These fees were not allocated to the segments. Please see Risk Factors on page 12 of our 2012 Annual Report,
and Note 16, Contingencies on pages F-46 through F-48 of our 2012 Annual Report, for more information regarding the FCPA
investigations, compliance reviews, and other related matters, including our expectations with respect to future professional and related fees
related to the FCPA investigations and compliance reviews.
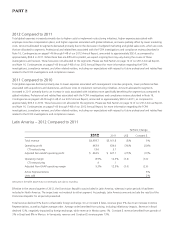
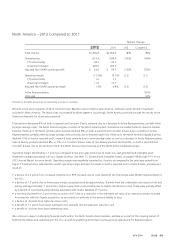
Latin America – 2012 Compared to 2011
%/Point Change
2012 2011 US$ Constant $
Total revenue $4,993.7 $5,161.8 (3)% 5%
Operating profit 443.9 634.0 (30)% (20)%
CTI restructuring 19.6 3.1
Adjusted Non-GAAP operating profit $ 463.5 $ 637.1 (27)% (17)%
Operating margin 8.9% 12.3% (3.4) (3.0)
CTI restructuring .4 .1
Adjusted Non-GAAP operating margin 9.3% 12.3% (3.0) (2.6)
Active Representatives 3%
Units sold 2%
Amounts in the table above may not necessarily sum due to rounding.
Effective in the second quarter of 2012, the Dominican Republic was included in Latin America, whereas in prior periods it had been
included in North America. The impact was not material to either segment. Accordingly, Latin America amounts include the results of the
Dominican Republic for all periods presented.
Total revenue declined 3% due to unfavorable foreign exchange. On a Constant $ basis, revenue grew 5% due to an increase in Active
Representatives, as well as higher average order. Average order benefited from pricing, including inflationary impacts. Revenue in Brazil
declined 12%, negatively impacted by foreign exchange, while revenue in Mexico grew 1%. Constant $ revenue benefited from growth of
3% in Brazil and 8% in Mexico. In Venezuela, revenue and Constant $ revenue grew 13%.