Avon 2012 Annual Report Download - page 39
Download and view the complete annual report
Please find page 39 of the 2012 Avon annual report below. You can navigate through the pages in the report by either clicking on the pages listed below, or by using the keyword search tool below to find specific information within the annual report.-
 1
1 -
2
-
3
-
4
-
5
-
6
-
7
-
8
-
9
-
10
-
11
-
12
-
13
-
14
-
15
-
16
-
17
-
18
-
19
-
20
-
21
-
22
-
23
-
24
-
25
-
26
-
27
-
28
-
 29
29 -
 30
30 -
 31
31 -
 32
32 -
 33
33 -
 34
34 -
 35
35 -
 36
36 -
 37
37 -
 38
38 -
 39
39 -
 40
40 -
 41
41 -
 42
42 -
 43
43 -
 44
44 -
 45
45 -
 46
46 -
 47
47 -
 48
48 -
 49
49 -
50
-
51
-
52
-
53
-
54
-
55
-
56
-
57
-
58
-
59
-
60
-
61
-
62
-
63
-
64
-
65
-
66
-
67
-
68
-
69
-
70
-
71
-
72
-
73
-
74
-
75
-
76
-
77
-
78
-
79
-
80
-
81
-
82
-
83
-
84
-
85
-
86
-
87
-
88
-
89
-
90
-
91
-
92
-
93
-
94
-
95
-
96
-
97
-
98
-
99
-
100
-
101
-
102
-
103
-
104
-
105
-
106
-
107
-
108
-
109
-
110
-
111
-
112
-
113
-
114
-
115
-
116
-
117
-
118
-
119
-
120
-
121
 |
 |
PART II
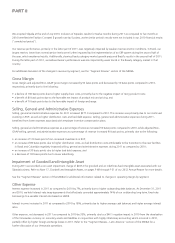
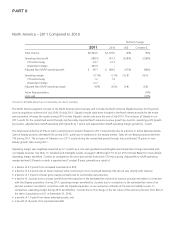
We acquired Silpada at the end of July 2010. Inclusion of Silpada’s results for twelve months during 2011 as compared to five months in
2010 benefited the Fashion Constant $ growth rate by 5 points, as the similar period’s results were not included in our 2010 financial results
(“unmatched period”).
Our revenue performance, primarily in the latter part of 2011, was negatively impacted by weaker macroeconomic conditions. In Brazil, our
largest market, lower than normal service levels were further impacted by the implementation of an ERP system during the second half of
the year, which weakened results. Additionally, slowing Beauty category market growth pressured Brazil’s results in the second half of 2011.
During the latter part of 2011, we believe Russia’s performance was also impacted by weak trends in the Beauty category market in that
country.
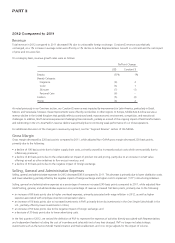
For additional discussion of the changes in revenue by segment, see the “Segment Review” section of this MD&A.
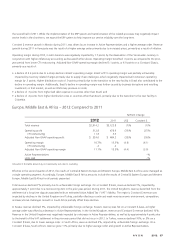
Gross Margin
Gross margin and adjusted Non-GAAP gross margin increased by 50 basis points and decreased by 10 basis points compared to 2010,
respectively, primarily due to the following:
• a decline of 160 basis points due to higher supply chain costs, primarily due to the negative impact of rising product costs;
• a benefit of 80 basis points due to the favorable net impact of product mix and pricing; and
• a benefit of 70 basis points due to the favorable impact of foreign exchange.
Selling, General and Administrative Expenses
Selling, general and administrative expenses for 2011 increased $277.0 compared to 2010. This increase was primarily due to our continued
investing in RVP, as well as higher distribution costs and bad debt expense. Selling, general and administrative expenses during 2011,
benefited from lower expenses associated with employee incentive compensation plans.
Selling, general and administrative expenses as a percentage of revenue increased 50 basis points compared to 2010, while adjusted Non-
GAAP selling, general, and administrative expenses as a percentage of revenue increased 90 basis points, primarily due to the following:
• an increase of 110 basis points from increased investments in RVP;
• an increase of 80 basis points due to higher distribution costs, as dual distribution costs attributable to the transition to the new facilities
in Brazil and Colombia negatively impacted selling, general and administrative expenses during 2011 as compared to 2010;
• an increase of 30 basis points due to higher bad debt expense; and
• a decrease of 100 basis points due to lower advertising.
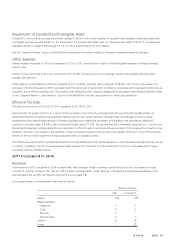
Impairment of Goodwill and Intangible Asset
During 2011 we recorded a non-cash impairment charge of $263.0 for goodwill and an indefinite-lived intangible asset associated with our
Silpada business. Refer to Note 17, Goodwill and Intangible Assets, on pages F-48 through F-51 of our 2012 Annual Report for more details.
See the “Segment Review” section of this MD&A for additional information related to changes in operating margin by segment.
Other Expense
Interest expense increased in 2011 as compared to 2010 by 7%, primarily due to higher outstanding debt balances. At December 31, 2011
and 2010, we held interest-rate swap agreements that effectively converted approximately 74% of our outstanding long-term, fixed-rate
borrowings to a variable interest rate based on LIBOR.
Interest income increased in 2011 as compared to 2010 by 18%, primarily due to higher average cash balances and higher average interest
rates.
Other expense, net decreased in 2011 as compared to 2010 by 35%, primarily due to a $46.1 negative impact in 2010 from the devaluation
of the Venezuelan currency on monetary assets and liabilities in conjunction with highly inflationary accounting which occurred in 2010,
partially offset by higher foreign exchange losses in 2011. Refer to the “Segment Review – Latin America” section of this MD&A for a
further discussion of our Venezuela operations.