Asus 2012 Annual Report Download - page 98
Download and view the complete annual report
Please find page 98 of the 2012 Asus annual report below. You can navigate through the pages in the report by either clicking on the pages listed below, or by using the keyword search tool below to find specific information within the annual report.-
 1
1 -
2
-
3
-
4
-
5
-
6
-
7
-
8
-
9
-
10
-
11
-
12
-
13
-
14
-
15
-
16
-
17
-
18
-
19
-
20
-
21
-
22
-
23
-
24
-
25
-
26
-
27
-
28
-
29
-
30
-
31
-
32
-
33
-
34
-
35
-
36
-
37
-
38
-
39
-
40
-
41
-
42
-
43
-
44
-
45
-
46
-
47
-
48
-
49
-
50
-
51
-
52
-
53
-
54
-
55
-
56
-
57
-
58
-
59
-
60
-
61
-
62
-
63
-
64
-
65
-
66
-
67
-
68
-
69
-
70
-
71
-
72
-
73
-
74
-
75
-
76
-
77
-
78
-
79
-
80
-
81
-
82
-
83
-
84
-
85
-
86
-
87
-
 88
88 -
 89
89 -
 90
90 -
 91
91 -
 92
92 -
 93
93 -
 94
94 -
 95
95 -
 96
96 -
 97
97 -
 98
98 -
 99
99 -
 100
100 -
 101
101 -
 102
102 -
 103
103 -
 104
104 -
 105
105 -
 106
106 -
 107
107 -
 108
108 -
109
-
110
-
111
-
112
-
113
-
114
-
115
-
116
-
117
-
118
-
119
-
120
-
121
-
122
-
123
-
124
-
125
-
126
-
127
-
128
-
129
-
130
-
131
-
132
-
133
-
134
-
135
-
136
-
137
-
138
-
139
-
140
-
141
-
142
-
143
-
144
-
145
-
146
-
147
-
148
-
149
-
150
-
151
-
152
-
153
-
154
-
155
-
156
-
157
-
158
-
159
-
160
-
161
-
162
-
163
-
164
-
165
-
166
-
167
-
168
-
169
-
170
-
171
-
172
-
173
-
174
-
175
-
176
-
177
-
178
-
179
-
180
-
181
-
182
-
183
-
184
-
185
-
186
-
187
-
188
-
189
-
190
-
191
-
192
-
193
-
194
-
195
-
196
-
197
-
198
-
199
-
200
-
201
-
202
-
203
-
204
-
205
-
206
-
207
-
208
-
209
-
210
-
211
-
212
-
213
-
214
-
215
-
216
-
217
-
218
-
219
-
220
-
221
 |
 |
94
94
!
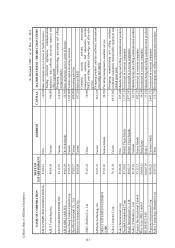
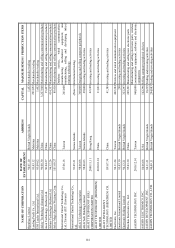
III. Analysis of cash flow
(I) Liquidity analysis of the last two years
Year
Item
2012 2011 Financial ratio change
Current ratio 21.89ʘ 14.83ʘ 47.61ʘ
Cash adequacy ratio 115.61ʘ 122.16ʘ (5.36)ʘ
Cash reinvestment ratio 4.19ʘ 0.42ʘ 897.62ʘ
Analysis of financial ratio change:
1. Decrease of cash flow ratio this year:
The increase of cash inflow for this year’s operating activities is greater than the
accounts payable and expenses for inbound material inventory as well as other
current liabilities, therefore the cash flow ratio increased.
2. Increase of cash reinvestment ratio this year:
Due to the revenue growth this year, the net cash inflow from operating activities
increased, therefore the cash reinvestment ratio increased.
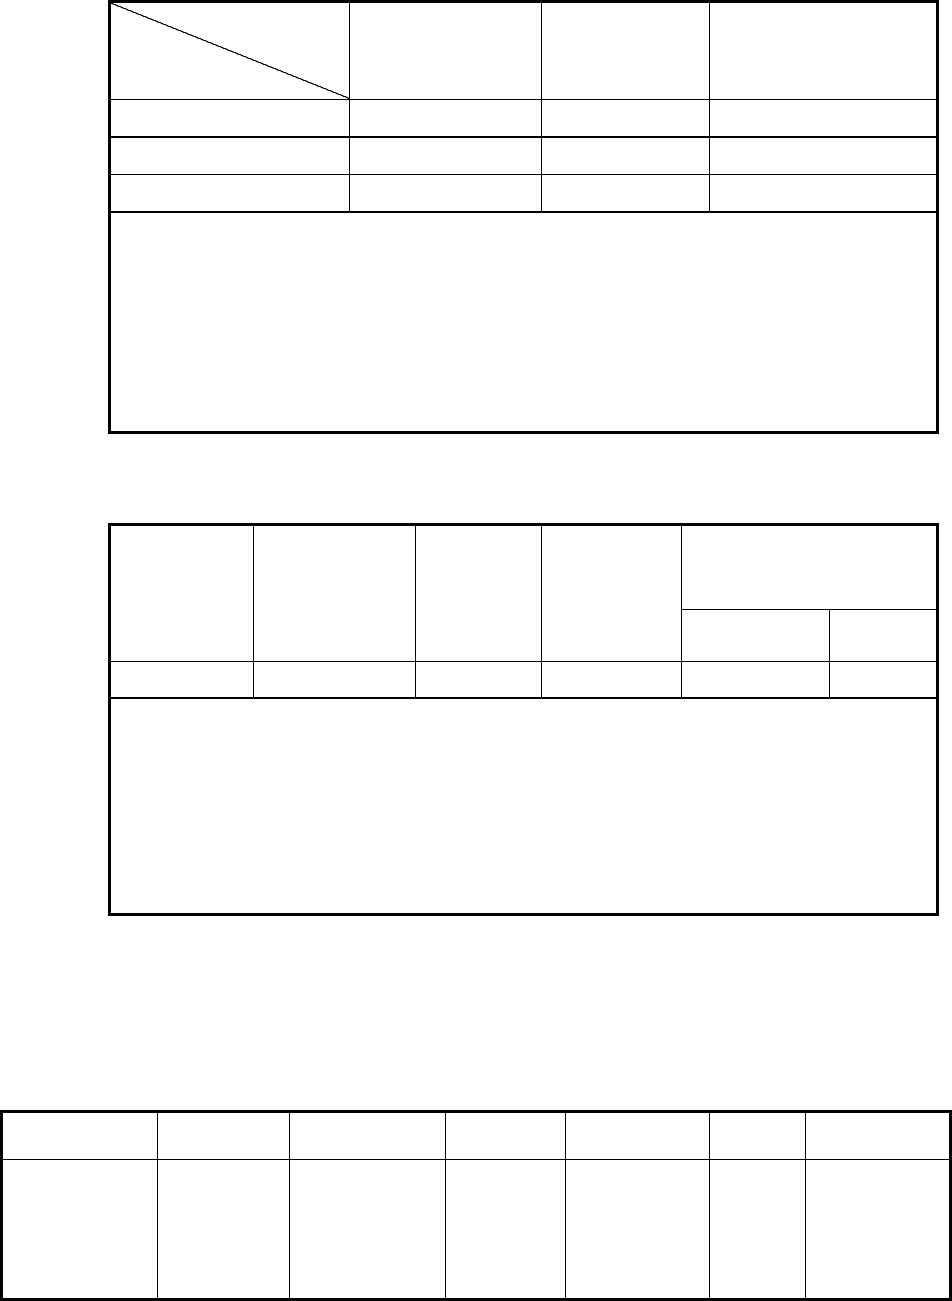
(II) Analysis of cash liquidity in one year
Unit: NT$100 million
Beginning cash
balancec
Expected net
cash flow from
operating activity
of the yeard
Expected
cash outflow
of the yeare
Expected cash
surplus
(deficit)
cɠdɡe
Remedial measures for the
expected insufficient cash
Investing
activity
Financing
activity
217.2 182.3 118.3 281.2 - -
1. Analysis of cash flow change:
(1)Operating activity: Net cash inflow from operating activity for an amount o
f
NT$18.23 billion
(2)Investing activity: Net cash outflow from investing activity including long-term
investment for an amount of NT$3.64 billion
(3)Financing activity: Net cash outflow from financing activity including dividend
distribution for an amount of NT$15.47 billion
2. Remedial measures for the expected insufficient cash and liquidity analysis: N/A
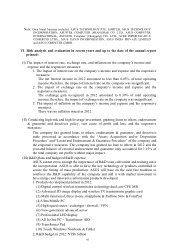
IV. The impact of significant capital expenditure on finance in recent years:
Significant capital expenditure and the source of fund: N/A
V. Reinvestment in recent years:
Unit: NT$ thousands
Item
(Note)!Amount!Policy Gain or Loss
in 2012!
Root cause of
profit or loss!
Corrective
action Investment Plans
Own brand
business!-!
Develop brand
business to
improve
competitiveness
and operating
performance
8,129,034
Focus on brand
marketing and
business
development
.! .!