Asus 2012 Annual Report Download - page 212
Download and view the complete annual report
Please find page 212 of the 2012 Asus annual report below. You can navigate through the pages in the report by either clicking on the pages listed below, or by using the keyword search tool below to find specific information within the annual report.-
 1
1 -
2
-
3
-
4
-
5
-
6
-
7
-
8
-
9
-
10
-
11
-
12
-
13
-
14
-
15
-
16
-
17
-
18
-
19
-
20
-
21
-
22
-
23
-
24
-
25
-
26
-
27
-
28
-
29
-
30
-
31
-
32
-
33
-
34
-
35
-
36
-
37
-
38
-
39
-
40
-
41
-
42
-
43
-
44
-
45
-
46
-
47
-
48
-
49
-
50
-
51
-
52
-
53
-
54
-
55
-
56
-
57
-
58
-
59
-
60
-
61
-
62
-
63
-
64
-
65
-
66
-
67
-
68
-
69
-
70
-
71
-
72
-
73
-
74
-
75
-
76
-
77
-
78
-
79
-
80
-
81
-
82
-
83
-
84
-
85
-
86
-
87
-
88
-
89
-
90
-
91
-
92
-
93
-
94
-
95
-
96
-
97
-
98
-
99
-
100
-
101
-
102
-
103
-
104
-
105
-
106
-
107
-
108
-
109
-
110
-
111
-
112
-
113
-
114
-
115
-
116
-
117
-
118
-
119
-
120
-
121
-
122
-
123
-
124
-
125
-
126
-
127
-
128
-
129
-
130
-
131
-
132
-
133
-
134
-
135
-
136
-
137
-
138
-
139
-
140
-
141
-
142
-
143
-
144
-
145
-
146
-
147
-
148
-
149
-
150
-
151
-
152
-
153
-
154
-
155
-
156
-
157
-
158
-
159
-
160
-
161
-
162
-
163
-
164
-
165
-
166
-
167
-
168
-
169
-
170
-
171
-
172
-
173
-
174
-
175
-
176
-
177
-
178
-
179
-
180
-
181
-
182
-
183
-
184
-
185
-
186
-
187
-
188
-
189
-
190
-
191
-
192
-
193
-
194
-
195
-
196
-
197
-
198
-
199
-
200
-
201
-
 202
202 -
 203
203 -
 204
204 -
 205
205 -
 206
206 -
 207
207 -
 208
208 -
 209
209 -
 210
210 -
 211
211 -
 212
212 -
 213
213 -
 214
214 -
 215
215 -
 216
216 -
 217
217 -
 218
218 -
 219
219 -
 220
220 -
 221
221
 |
 |

208
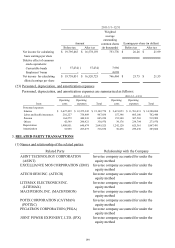
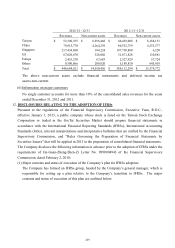
(3) Financial information
Note 1:
The intra-segment revenues have been eliminated to $0.
Note 2:
Because the Group’s segment assets are not provided to the chief operating
decision-maker, such items are not required to be disclosed.
(4) Reconciliation of operating segments’ operating profit
A. The revenues from external customers reported to the chief operating decision-maker are
measured in a manner consistent with the consolidated statements of income.
B. The reconciliation between the reportable segment’s profit and segment profit (others are the
same as consolidated statements of income) is as follows:
(5) Information by geographic area
The Group allocates the revenues and non-current assets on the basis of the location of the single
country or area:
3C Brand Others Total
Revenues from external customers 413,129,676$ 35,554,945$ 448,684,621$
Revenues from other segments 15,563$ 7,776,545$ -(Note 1)
Segment profit 22,010,771$ 84,740)($ 21,926,031$
Identifiable assets (Note 2) -$ -$ -$
2012/1/1~12/31
3C Brand Others Total
Revenues from external customers 344,128,000$ 39,984,294$ 384,112,294$
Revenues from other segments 6,350,520$ 7,408,096$ -(Note 1)
Segment profit 18,051,798$ 134,273$ 18,186,071$
Identifiable assets (Note 2) -$ -$ -$
2011/1/1~12/31
2012/1/1~12/31 2011/1/1~12/31
Reportable operating segments’ profit before
adjustment
21,926,031$ 18,186,071$
Unallocated profit or loss 87,275)( 43,430
Reportable operating segments’ profit 21,838,756$ 18,229,501$