Asus 2012 Annual Report Download - page 209
Download and view the complete annual report
Please find page 209 of the 2012 Asus annual report below. You can navigate through the pages in the report by either clicking on the pages listed below, or by using the keyword search tool below to find specific information within the annual report.-
 1
1 -
2
-
3
-
4
-
5
-
6
-
7
-
8
-
9
-
10
-
11
-
12
-
13
-
14
-
15
-
16
-
17
-
18
-
19
-
20
-
21
-
22
-
23
-
24
-
25
-
26
-
27
-
28
-
29
-
30
-
31
-
32
-
33
-
34
-
35
-
36
-
37
-
38
-
39
-
40
-
41
-
42
-
43
-
44
-
45
-
46
-
47
-
48
-
49
-
50
-
51
-
52
-
53
-
54
-
55
-
56
-
57
-
58
-
59
-
60
-
61
-
62
-
63
-
64
-
65
-
66
-
67
-
68
-
69
-
70
-
71
-
72
-
73
-
74
-
75
-
76
-
77
-
78
-
79
-
80
-
81
-
82
-
83
-
84
-
85
-
86
-
87
-
88
-
89
-
90
-
91
-
92
-
93
-
94
-
95
-
96
-
97
-
98
-
99
-
100
-
101
-
102
-
103
-
104
-
105
-
106
-
107
-
108
-
109
-
110
-
111
-
112
-
113
-
114
-
115
-
116
-
117
-
118
-
119
-
120
-
121
-
122
-
123
-
124
-
125
-
126
-
127
-
128
-
129
-
130
-
131
-
132
-
133
-
134
-
135
-
136
-
137
-
138
-
139
-
140
-
141
-
142
-
143
-
144
-
145
-
146
-
147
-
148
-
149
-
150
-
151
-
152
-
153
-
154
-
155
-
156
-
157
-
158
-
159
-
160
-
161
-
162
-
163
-
164
-
165
-
166
-
167
-
168
-
169
-
170
-
171
-
172
-
173
-
174
-
175
-
176
-
177
-
178
-
179
-
180
-
181
-
182
-
183
-
184
-
185
-
186
-
187
-
188
-
189
-
190
-
191
-
192
-
193
-
194
-
195
-
196
-
197
-
198
-
 199
199 -
 200
200 -
 201
201 -
 202
202 -
 203
203 -
 204
204 -
 205
205 -
 206
206 -
 207
207 -
 208
208 -
 209
209 -
 210
210 -
 211
211 -
 212
212 -
 213
213 -
 214
214 -
 215
215 -
 216
216 -
 217
217 -
 218
218 -
 219
219 -
220
-
221
 |
 |

205
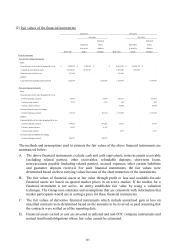
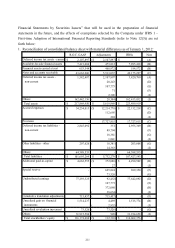
(2) Fair values of the financial instruments
The methods and assumptions used to estimate the fair values of the above financial instruments are
summarized below:
A. The above financial instruments exclude cash and cash equivalents, notes/accounts receivable
(including related parties), other receivables, refundable deposits, short-term loans,
notes/accounts payable (including related parties), accrued expenses, other current liabilities
and guarantee deposits received. For such financial instruments, the fair values were
determined based on their carrying values because of the short maturities of the instruments.
B. The fair values of financial assets at fair value through profit or loss and available-for-sale
financial assets are based on quoted market prices in an active market. If the market for a
financial instrument is not active, an entity establishes fair value by using a valuation
technique. The Group uses estimates and assumptions that are consistent with information that
market participants would use in setting a price for these financial instruments.
C. The fair values of derivative financial instruments which include unrealized gain or loss on
unsettled contracts were determined based on the amounts to be received or paid assuming that
the contracts were settled as of the reporting date.
D. Financial assets carried at cost are invested in unlisted and non-OTC company instruments and
mutual fund bond obligations whose fair value cannot be estimated.
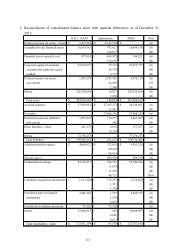
Estimated Estimated
Quotations using a Quotations using a
in an active valuation in an active valuation
Book value market technique Book value market technique
Financial instruments
Non-derivative financial instruments
Assets
Financial assets at fair value through profit or loss 9,202,568$ 9,202,568$ -$ 10,884,188$ 10,884,188$ -$
Available-for-sale financial assets 10,634,361 10,634,361 - 7,421,606 7,421,606 -
Financial assets carried at cost 477,014 - - 653,544 - -
Liabilities -
Long-term loans (including current portion) 1,829,276 - 1,829,276 1,818,436 - 1,818,436
Derivative financial instruments
Assets
Financial assets at fair value through profit or loss
Forward exchange contracts 66,497 - 66,497 686,335 - 686,335
Currency swap contracts 2,176 - 2,176 884 - 884
Currency option contracts - - - 38,788 - 38,788
Derivative financial assets for hedging
Forward exchange contracts 116,334 - 116,334 1,354,470 - 1,354,470
Liabilities
Financial liabilities at fair value through profit or loss
Forward exchange contracts 580,526 - 580,526 35,595 - 35,595
Currency option contracts 31,567 - 31,567 - - -
Currency swap contracts - - - 1,457 - 1,457
Derivative financial liabilities for hedging
Forward exchange contracts 408,375 - 408,375 - - -
2012/12/31
2011/12/31
Fair value
Fair value