Asus 2012 Annual Report Download - page 96
Download and view the complete annual report
Please find page 96 of the 2012 Asus annual report below. You can navigate through the pages in the report by either clicking on the pages listed below, or by using the keyword search tool below to find specific information within the annual report.-
 1
1 -
2
-
3
-
4
-
5
-
6
-
7
-
8
-
9
-
10
-
11
-
12
-
13
-
14
-
15
-
16
-
17
-
18
-
19
-
20
-
21
-
22
-
23
-
24
-
25
-
26
-
27
-
28
-
29
-
30
-
31
-
32
-
33
-
34
-
35
-
36
-
37
-
38
-
39
-
40
-
41
-
42
-
43
-
44
-
45
-
46
-
47
-
48
-
49
-
50
-
51
-
52
-
53
-
54
-
55
-
56
-
57
-
58
-
59
-
60
-
61
-
62
-
63
-
64
-
65
-
66
-
67
-
68
-
69
-
70
-
71
-
72
-
73
-
74
-
75
-
76
-
77
-
78
-
79
-
80
-
81
-
82
-
83
-
84
-
85
-
 86
86 -
 87
87 -
 88
88 -
 89
89 -
 90
90 -
 91
91 -
 92
92 -
 93
93 -
 94
94 -
 95
95 -
 96
96 -
 97
97 -
 98
98 -
 99
99 -
 100
100 -
 101
101 -
 102
102 -
 103
103 -
 104
104 -
 105
105 -
 106
106 -
107
-
108
-
109
-
110
-
111
-
112
-
113
-
114
-
115
-
116
-
117
-
118
-
119
-
120
-
121
-
122
-
123
-
124
-
125
-
126
-
127
-
128
-
129
-
130
-
131
-
132
-
133
-
134
-
135
-
136
-
137
-
138
-
139
-
140
-
141
-
142
-
143
-
144
-
145
-
146
-
147
-
148
-
149
-
150
-
151
-
152
-
153
-
154
-
155
-
156
-
157
-
158
-
159
-
160
-
161
-
162
-
163
-
164
-
165
-
166
-
167
-
168
-
169
-
170
-
171
-
172
-
173
-
174
-
175
-
176
-
177
-
178
-
179
-
180
-
181
-
182
-
183
-
184
-
185
-
186
-
187
-
188
-
189
-
190
-
191
-
192
-
193
-
194
-
195
-
196
-
197
-
198
-
199
-
200
-
201
-
202
-
203
-
204
-
205
-
206
-
207
-
208
-
209
-
210
-
211
-
212
-
213
-
214
-
215
-
216
-
217
-
218
-
219
-
220
-
221
 |
 |
92
92
!
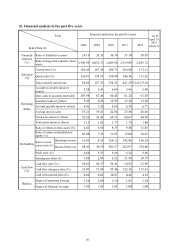
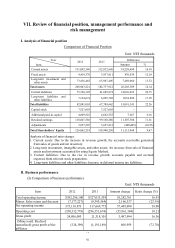
VII. Review of financial position, management performance and
risk management
I. Analysis of financial position
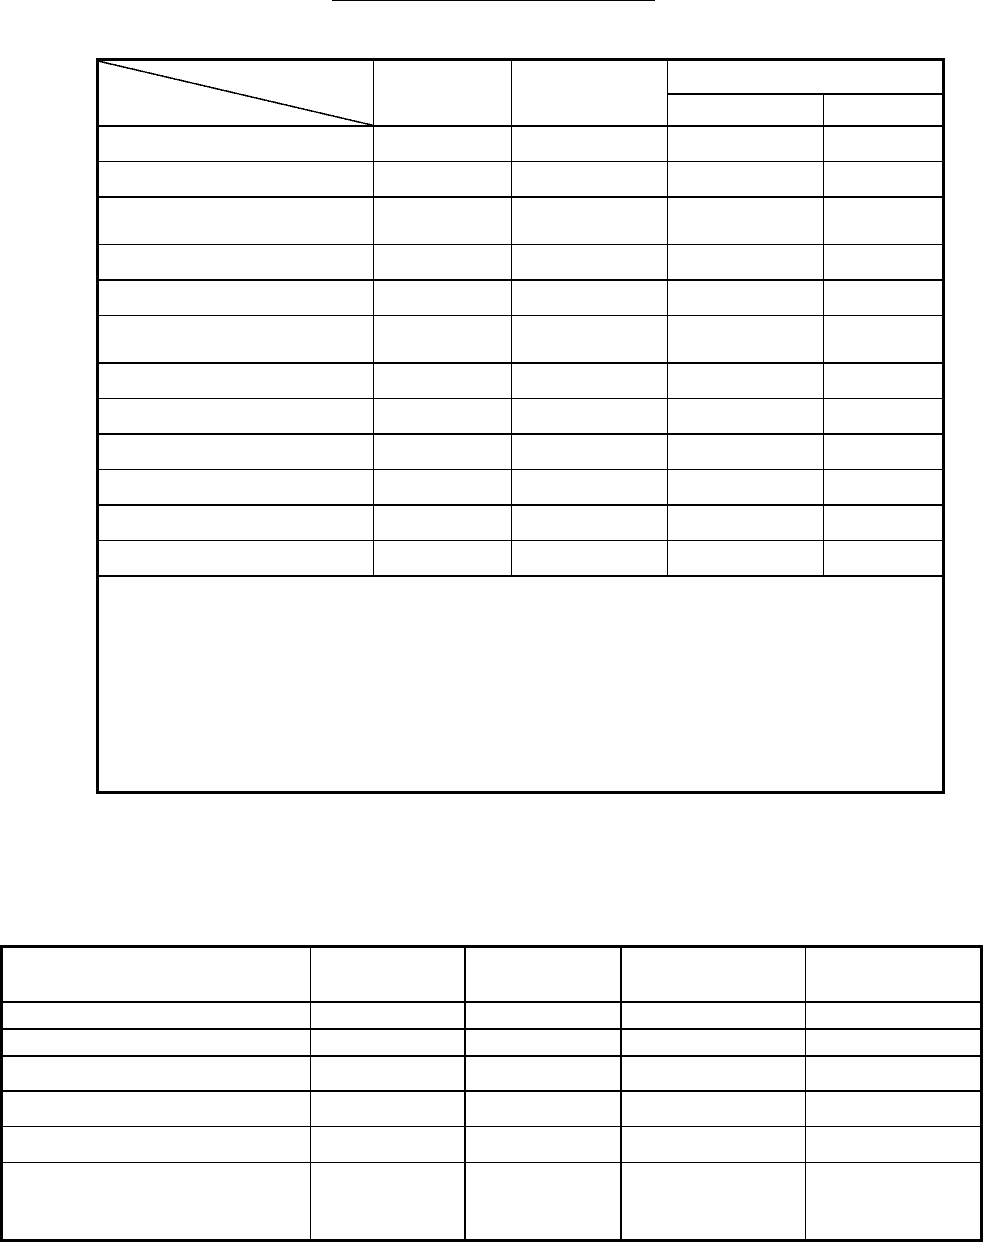
Comparison of Financial Position
Unit: NT$ thousands
Year
Item
2012 2011 Difference
Amount %
Current assets 131,092,386 112,832,696 18,259,690 16.18
Fixed assets 4,414,370 3,937,811 476,559 12.10
Long-term investment and
other assets 73,436,465 65,967,405 7,469,060 11.32
Total assets 208,943,221 182,737,912 26,205,309 14.34
Current liabilities 75,726,329 61,689,874 14,036,455 22.75
Long-term liabilities and
other liabilities 7,154,674 6,099,788 1,054,886 17.29
Total liabilities 82,881,003 67,789,662 15,091,341 22.26
Capital stock 7,527,603 7,527,603 - -
Additional paid-in capital 4,669,822 4,662,555 7,267 0.16
Retained earnings 110,607,586 99,100,280 11,507,306 11.61
Adjustments 3,257,207 3,657,812 (400,605) (10.95)
Total Shareholders’ Equity 126,062,218 114,948,250 11,113,968 9.67
Analysis of financial ratio change:
1. Current assets: Due to the increase in revenue growth, the accounts receivable generated
from sales of goods and net inventory.
2. Long-term investment, intangible assets, and other assets: An increase from sale of financial
assets and investment accounted for using Equity Method.
3. Current liabilities: Due to the rise in revenue growth, accounts payable and accrued
expenses from relevant stock preparation.
4.!Long-term liabilities and other liabilities: Increase in deferred income tax liabilities.
II. Business performance
(I) Comparison of business performance
Unit: NT$ thousands
Item 2012 2011 Amount change Ratio change (%)
Total operating income $382,296,100 $327,013,339 55,282,761 16.91
Minus: Sales return and discount (7,177,227) (9,343,564) 2,166,337 (23.19)
Net operating income 375,118,873 317,669,775 57,449,098 18.08
Operating cost (350,312,778) (296,351,674) (53,961,104) 18.21
Gross profit 24,806,095 21,318,101 3,487,994 16.36
(Minus) add: Realized
(unrealized) gross profit of the
affiliates
(324,190) (1,191,149) 866,959 (72.78)