Asus 2012 Annual Report Download - page 188
Download and view the complete annual report
Please find page 188 of the 2012 Asus annual report below. You can navigate through the pages in the report by either clicking on the pages listed below, or by using the keyword search tool below to find specific information within the annual report.-
 1
1 -
2
-
3
-
4
-
5
-
6
-
7
-
8
-
9
-
10
-
11
-
12
-
13
-
14
-
15
-
16
-
17
-
18
-
19
-
20
-
21
-
22
-
23
-
24
-
25
-
26
-
27
-
28
-
29
-
30
-
31
-
32
-
33
-
34
-
35
-
36
-
37
-
38
-
39
-
40
-
41
-
42
-
43
-
44
-
45
-
46
-
47
-
48
-
49
-
50
-
51
-
52
-
53
-
54
-
55
-
56
-
57
-
58
-
59
-
60
-
61
-
62
-
63
-
64
-
65
-
66
-
67
-
68
-
69
-
70
-
71
-
72
-
73
-
74
-
75
-
76
-
77
-
78
-
79
-
80
-
81
-
82
-
83
-
84
-
85
-
86
-
87
-
88
-
89
-
90
-
91
-
92
-
93
-
94
-
95
-
96
-
97
-
98
-
99
-
100
-
101
-
102
-
103
-
104
-
105
-
106
-
107
-
108
-
109
-
110
-
111
-
112
-
113
-
114
-
115
-
116
-
117
-
118
-
119
-
120
-
121
-
122
-
123
-
124
-
125
-
126
-
127
-
128
-
129
-
130
-
131
-
132
-
133
-
134
-
135
-
136
-
137
-
138
-
139
-
140
-
141
-
142
-
143
-
144
-
145
-
146
-
147
-
148
-
149
-
150
-
151
-
152
-
153
-
154
-
155
-
156
-
157
-
158
-
159
-
160
-
161
-
162
-
163
-
164
-
165
-
166
-
167
-
168
-
169
-
170
-
171
-
172
-
173
-
174
-
175
-
176
-
177
-
 178
178 -
 179
179 -
 180
180 -
 181
181 -
 182
182 -
 183
183 -
 184
184 -
 185
185 -
 186
186 -
 187
187 -
 188
188 -
 189
189 -
 190
190 -
 191
191 -
 192
192 -
 193
193 -
 194
194 -
 195
195 -
 196
196 -
 197
197 -
 198
198 -
199
-
200
-
201
-
202
-
203
-
204
-
205
-
206
-
207
-
208
-
209
-
210
-
211
-
212
-
213
-
214
-
215
-
216
-
217
-
218
-
219
-
220
-
221
 |
 |

184
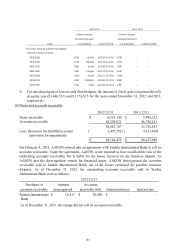
(3) Available-for-sale financial assets
A. For available-for-sale financial assets, the amount of gain recognized directly in equity was
$2,975,126 and $316,902 for the years ended December 31, 2012 and 2011, respectively.
B. After evaluating and comparing the carrying value of available-for-sale financial assets and its
recoverable amount, the Group recognized impairment loss amounting to $62,585 and $37,636
for the years ended December 31, 2012 and 2011, respectively.
(4) Financial assets carried at cost
A. The above investments were measured at cost since there are no public quotes in active
markets and their fair value cannot be measured reliably.
B. After evaluating and comparing the carrying value of financial assets carried at cost and its
recoverable amount, the Group recognized impairment loss amounting to $95,938 and
$117,000 for the years ended December 31, 2012 and 2011, respectively.
Items 2012/12/31 2011/12/31
Current:
Listed and OTC stocks
AZURE 217,379$ 250,672$
Others 176,717 95,251
394,096 345,923
Less: provision for impairmaent 51,929)( 12,000)(
342,167$ 333,923$
Non-current:
Listed and OTC stocks
ADVANTECH 10,255,695$ 7,015,732$
Others 62,109 98,650
10,317,804 7,114,382
Less: provision for impairmaent 25,610)( 26,699)(
10,292,194$ 7,087,683$
Items 2012/12/31 2011/12/31
Current:
Unlisted and non-OTC stocks
Others 372$ 372$
Non-current:
Unlisted and non-OTC stocks
MSTAR 122,696$ 122,696$
AMTRUST CAPITAL I 100,000 100,000
UPI - 199,000
Others 444,193 497,159
Private fund 36,399 37,947
703,288 956,802
Less: provision for impairmaent 226,646)( 303,630)(
476,642$ 653,172$