Asus 2012 Annual Report Download - page 141
Download and view the complete annual report
Please find page 141 of the 2012 Asus annual report below. You can navigate through the pages in the report by either clicking on the pages listed below, or by using the keyword search tool below to find specific information within the annual report.-
 1
1 -
2
-
3
-
4
-
5
-
6
-
7
-
8
-
9
-
10
-
11
-
12
-
13
-
14
-
15
-
16
-
17
-
18
-
19
-
20
-
21
-
22
-
23
-
24
-
25
-
26
-
27
-
28
-
29
-
30
-
31
-
32
-
33
-
34
-
35
-
36
-
37
-
38
-
39
-
40
-
41
-
42
-
43
-
44
-
45
-
46
-
47
-
48
-
49
-
50
-
51
-
52
-
53
-
54
-
55
-
56
-
57
-
58
-
59
-
60
-
61
-
62
-
63
-
64
-
65
-
66
-
67
-
68
-
69
-
70
-
71
-
72
-
73
-
74
-
75
-
76
-
77
-
78
-
79
-
80
-
81
-
82
-
83
-
84
-
85
-
86
-
87
-
88
-
89
-
90
-
91
-
92
-
93
-
94
-
95
-
96
-
97
-
98
-
99
-
100
-
101
-
102
-
103
-
104
-
105
-
106
-
107
-
108
-
109
-
110
-
111
-
112
-
113
-
114
-
115
-
116
-
117
-
118
-
119
-
120
-
121
-
122
-
123
-
124
-
125
-
126
-
127
-
128
-
129
-
130
-
 131
131 -
 132
132 -
 133
133 -
 134
134 -
 135
135 -
 136
136 -
 137
137 -
 138
138 -
 139
139 -
 140
140 -
 141
141 -
 142
142 -
 143
143 -
 144
144 -
 145
145 -
 146
146 -
 147
147 -
 148
148 -
 149
149 -
 150
150 -
 151
151 -
152
-
153
-
154
-
155
-
156
-
157
-
158
-
159
-
160
-
161
-
162
-
163
-
164
-
165
-
166
-
167
-
168
-
169
-
170
-
171
-
172
-
173
-
174
-
175
-
176
-
177
-
178
-
179
-
180
-
181
-
182
-
183
-
184
-
185
-
186
-
187
-
188
-
189
-
190
-
191
-
192
-
193
-
194
-
195
-
196
-
197
-
198
-
199
-
200
-
201
-
202
-
203
-
204
-
205
-
206
-
207
-
208
-
209
-
210
-
211
-
212
-
213
-
214
-
215
-
216
-
217
-
218
-
219
-
220
-
221
 |
 |

137
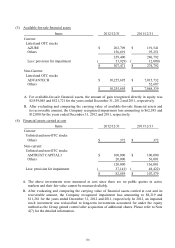
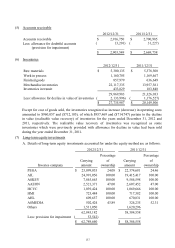
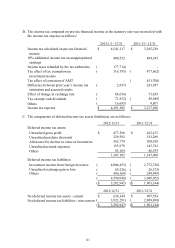
(5) Accounts receivable
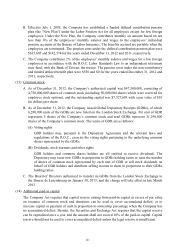
(6) Inventories
Except for cost of goods sold, the inventories recognized as increase (decrease) in operating costs
amounted to $960,057 and ($712,105), of which $957,469 and ($714,747) pertain to the decline
in value (realizable value recovery) of inventories for the years ended December 31, 2012 and
2011, respectively. The realizable value recovery of inventories was recognized as some
inventories which were previously provided with allowance for decline in value had been sold
during the year ended December 31, 2011.
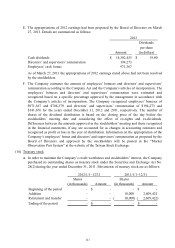
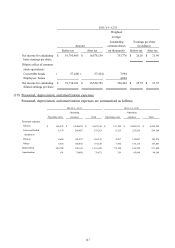
(7) Long-term equity investments
A. Details of long-term equity investments accounted for under the equity method are as follows:
2012/12/31 2011/12/31
Accounts receivable 2,916,750$ 2,700,985$
Less: allowance for doubtful accounts 13,201)( 31,227)(
(provision for impairment)
2,903,549$ 2,669,758$
2012/12/31 2011/12/31
Raw materials 5,300,135$ 5,378,508$
Work in process 1,160,705 1,169,467
Finished goods 857,979 636,649
Merchandise inventories 22,117,335 13,957,561
Inventories in transit 433,829 183,848
29,869,983 21,326,033
Less: allowance for decline in value of inventories 2,133,996)( 1,176,527)(
27,735,987$ 20,149,506$
Percentage Percentage
Carrying of Carrying of
Investee company amount
ownership
amount
ownership
PEGA 23,099,053$ 24.08 22,374,681$ 24.46
AIL 24,991,056 100.00 19,415,417 100.00
ASKEY 7,845,663 100.00 9,584,598 100.00
AAEON 2,521,371 47.00 2,607,452 47.00
HCVC 1,039,424 100.00 1,069,666 100.00
HMI 723,484 100.00 717,382 100.00
AHL 609,657 100.00 670,831 100.00
ASMEDIA 502,424 43.89 324,235 52.31
Others 1,511,050 1,620,296
62,843,182 58,384,558
Less: provision for impairment 53,542)( -
62,789,640$ 58,384,558$
2012/12/31
2011/12/31