Asus 2012 Annual Report Download - page 130
Download and view the complete annual report
Please find page 130 of the 2012 Asus annual report below. You can navigate through the pages in the report by either clicking on the pages listed below, or by using the keyword search tool below to find specific information within the annual report.-
 1
1 -
2
-
3
-
4
-
5
-
6
-
7
-
8
-
9
-
10
-
11
-
12
-
13
-
14
-
15
-
16
-
17
-
18
-
19
-
20
-
21
-
22
-
23
-
24
-
25
-
26
-
27
-
28
-
29
-
30
-
31
-
32
-
33
-
34
-
35
-
36
-
37
-
38
-
39
-
40
-
41
-
42
-
43
-
44
-
45
-
46
-
47
-
48
-
49
-
50
-
51
-
52
-
53
-
54
-
55
-
56
-
57
-
58
-
59
-
60
-
61
-
62
-
63
-
64
-
65
-
66
-
67
-
68
-
69
-
70
-
71
-
72
-
73
-
74
-
75
-
76
-
77
-
78
-
79
-
80
-
81
-
82
-
83
-
84
-
85
-
86
-
87
-
88
-
89
-
90
-
91
-
92
-
93
-
94
-
95
-
96
-
97
-
98
-
99
-
100
-
101
-
102
-
103
-
104
-
105
-
106
-
107
-
108
-
109
-
110
-
111
-
112
-
113
-
114
-
115
-
116
-
117
-
118
-
119
-
 120
120 -
 121
121 -
 122
122 -
 123
123 -
 124
124 -
 125
125 -
 126
126 -
 127
127 -
 128
128 -
 129
129 -
 130
130 -
 131
131 -
 132
132 -
 133
133 -
 134
134 -
 135
135 -
 136
136 -
 137
137 -
 138
138 -
 139
139 -
 140
140 -
141
-
142
-
143
-
144
-
145
-
146
-
147
-
148
-
149
-
150
-
151
-
152
-
153
-
154
-
155
-
156
-
157
-
158
-
159
-
160
-
161
-
162
-
163
-
164
-
165
-
166
-
167
-
168
-
169
-
170
-
171
-
172
-
173
-
174
-
175
-
176
-
177
-
178
-
179
-
180
-
181
-
182
-
183
-
184
-
185
-
186
-
187
-
188
-
189
-
190
-
191
-
192
-
193
-
194
-
195
-
196
-
197
-
198
-
199
-
200
-
201
-
202
-
203
-
204
-
205
-
206
-
207
-
208
-
209
-
210
-
211
-
212
-
213
-
214
-
215
-
216
-
217
-
218
-
219
-
220
-
221
 |
 |

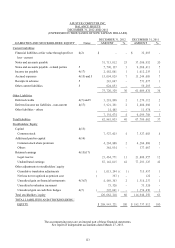
126
ASUSTEK COMPUTER INC.
STATEMENTS OF CASH FLOWS
FOR THE YEARS ENDED DECEMBER 31, 2012 AND 2011
(EXPRESSED IN THOUSANDS OF NEW TAIWAN DOLLARS)
FOR THE YEARS ENDED DECEMBER 31,
2012
2011
The accompanying notes are an integral part of these financial statements.
See report of independent accountants dated March 27, 2013.
Cash flows from operating activities
Net income
$
22,422,330
$
16,578,159
Adjustments to reconcile net income to net cash provided by
operating activities
Depreciation, amortization and impairment
1,311,960
1,509,094
Cash dividends received from long-term equity investments
accounted for under the equity method
298,951
1,303,736
Investment income accounted for under the equity method
(
9,489,163
)
(
7,274,803
)
Changes in assets and liabilities
Financial assets at fair value through profit or loss - current
2,028,338
(
1,599,905
)
Notes and accounts receivable (including related parties)
(
14,383,512
)
(
4,587,375
)
Other receivables
6,269,832
(
6,680,610
)
Inventories
(
7,586,481
)
(
4,569,209
)
Prepayments and other current assets
(
8,473
)
5,359,651
Financial liabilities at fair value through profit or loss -
current
(
32,695
)
(
73,200
)
Notes and accounts payable (including related parties)
13,096,280
3,047,839
Income tax payable
849,846
295,693
Accrued expenses, receipts in advance and other current
liabilities
419,577
3,663,165
Deferred credits
324,190
1,191,149
Deferred income tax assets and liabilities
1,135,383
888,226
Others
(
79,852
)
96,672
Net cash provided by operating activities
16,576,511
9,148,282
Cash flows from investing activities
Proceeds from capital reduction of long-term equity investments
accounted for under the equity method
1,223,461
-
Increase in long-term equity investments accounted for under the
equity method
(
339,528
)
(
3,185,945
)
Acquisition of property, plant and equipment
(
1,594,393
)
(
1,074,166
)
Others
158,944
12,141
Net cash used in investing activities
(
551,516
)
(
4,247,970
)
Cash flows from financing activities
Redemption of bonds payable
-
(
2,459,400
)
Redemption of treasury stock
-
(
2,609,422
)
Payment of cash dividends
(
10,915,024
)
(
8,638,233
)
Others
2,507
92
Net cash used in financing activities
(
10,912,517
)
(
13,706,963
)
Increase (decrease) in cash and cash equivalents
5,112,478
(
8,806,651
)
Cash and cash equivalents at beginning of the year
16,608,239
25,414,890
Cash and cash equivalents at end of the year
$
21,720,717
$
16,608,239
Supplemental disclosures of cash flow information
Cash paid during the year for interest
$
5
$
8
Cash paid during the year for income tax
$
2,306,073
$
2,336,873
Investing and financing activities that result in non-cash flows:
Dividends transferred to common stock
$
-
$
1,357,437