Asus 2012 Annual Report Download - page 80
Download and view the complete annual report
Please find page 80 of the 2012 Asus annual report below. You can navigate through the pages in the report by either clicking on the pages listed below, or by using the keyword search tool below to find specific information within the annual report.-
 1
1 -
2
-
3
-
4
-
5
-
6
-
7
-
8
-
9
-
10
-
11
-
12
-
13
-
14
-
15
-
16
-
17
-
18
-
19
-
20
-
21
-
22
-
23
-
24
-
25
-
26
-
27
-
28
-
29
-
30
-
31
-
32
-
33
-
34
-
35
-
36
-
37
-
38
-
39
-
40
-
41
-
42
-
43
-
44
-
45
-
46
-
47
-
48
-
49
-
50
-
51
-
52
-
53
-
54
-
55
-
56
-
57
-
58
-
59
-
60
-
61
-
62
-
63
-
64
-
65
-
66
-
67
-
68
-
69
-
 70
70 -
 71
71 -
 72
72 -
 73
73 -
 74
74 -
 75
75 -
 76
76 -
 77
77 -
 78
78 -
 79
79 -
 80
80 -
 81
81 -
 82
82 -
 83
83 -
 84
84 -
 85
85 -
 86
86 -
 87
87 -
 88
88 -
 89
89 -
 90
90 -
91
-
92
-
93
-
94
-
95
-
96
-
97
-
98
-
99
-
100
-
101
-
102
-
103
-
104
-
105
-
106
-
107
-
108
-
109
-
110
-
111
-
112
-
113
-
114
-
115
-
116
-
117
-
118
-
119
-
120
-
121
-
122
-
123
-
124
-
125
-
126
-
127
-
128
-
129
-
130
-
131
-
132
-
133
-
134
-
135
-
136
-
137
-
138
-
139
-
140
-
141
-
142
-
143
-
144
-
145
-
146
-
147
-
148
-
149
-
150
-
151
-
152
-
153
-
154
-
155
-
156
-
157
-
158
-
159
-
160
-
161
-
162
-
163
-
164
-
165
-
166
-
167
-
168
-
169
-
170
-
171
-
172
-
173
-
174
-
175
-
176
-
177
-
178
-
179
-
180
-
181
-
182
-
183
-
184
-
185
-
186
-
187
-
188
-
189
-
190
-
191
-
192
-
193
-
194
-
195
-
196
-
197
-
198
-
199
-
200
-
201
-
202
-
203
-
204
-
205
-
206
-
207
-
208
-
209
-
210
-
211
-
212
-
213
-
214
-
215
-
216
-
217
-
218
-
219
-
220
-
221
 |
 |

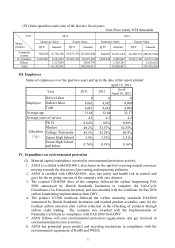
76
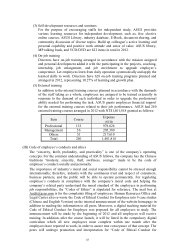
MEMORY ELPIDA, HYNIX, SAMSUNG, MICRON, Nanya
LCD LGD, AUO, INX
Most of the aforementioned manufacturers are domestic and international with good
quality and reputation built; moreover, they have been in business with ASUS for years
in a good term with raw materials supplied to ASUS that help the company to stay
competitive.
(IV) Major Customers with over 10% net sales and Suppliers with over 10% total purchases
of the last two fiscal years
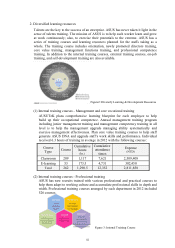
1. Major Suppliers of the last two fiscal years
Unit: NT$ thousands
2011 2012 2013Q1 (Note 1)
Item Name Amount
Percentage of
net annual
purchase (%)
Relation
with
issuer
Name Amount
Percentage of
net annual
purchase (%)
Relation
with
issuer
Name Amount
Percentage of
net purchase
of Q1 (%)
Relatio
n with
issuer
1 PEGA 166,608,812 34.85
Invested
company
valued
with
equity
method
PEGA 131,662,808 24.09
Invested
company
valued
with
equity
method
2 T customer 67,516,795 14.13 None T customer 92,514,581 16.93 None
3 F customer 109,280,057 22.86 None F customer 75,626,026 13.84 None
4 Others 134,610,962 28.16 Others 246,092,008 45.14 Others
Net
purchase
amount
478,016,626 100
Net
purchase
amount
546,573,783 100
Net
purchase
amount
100
Note 1: The 2013Q1 financial statements audited by the CPA were not yet available up to the print of annual
report on April 19, 2013.
Note 2: The purchase amount from the last two years included raw material amount purchased for clients.
Note 3: Causes of increase and decrease – for business operation
2. Major Customers of the last two fiscal years
Unit: NT$ thousands
2011 2012 2013Q1
(Note 1)
Item Name Amount
Percentage
of annual
net sales
(%)
Relation with
issuer Name Amount
Percentage
of annual
net sales
(%)
Relation
with issuer
Name
Amount
Percentage
of net sales
of Q1 (%)
Relati
on
with
issuer
1 ASTP 295,505,139 93
Invested
company
valued with
equity method
ASTP 353,448,218 94
Invested
company
valued with
equity
method
Others 22,164,636 7 Others 21,670,655 6 Others
Net sales
amount 317,669,775 100 Net sales
amount 375,118,873 100
Net
sales
amount
Note 1: The 2013Q1 financial statements audited by the CPA were not yet available up to the print of annual
report on April 19, 2013.
Note 2: Causes of increase and decrease – for business operation
(V) Production/Sales Quantities and Value over the Past Two Year: Not Applicable