Asus 2012 Annual Report Download - page 97
Download and view the complete annual report
Please find page 97 of the 2012 Asus annual report below. You can navigate through the pages in the report by either clicking on the pages listed below, or by using the keyword search tool below to find specific information within the annual report.-
 1
1 -
2
-
3
-
4
-
5
-
6
-
7
-
8
-
9
-
10
-
11
-
12
-
13
-
14
-
15
-
16
-
17
-
18
-
19
-
20
-
21
-
22
-
23
-
24
-
25
-
26
-
27
-
28
-
29
-
30
-
31
-
32
-
33
-
34
-
35
-
36
-
37
-
38
-
39
-
40
-
41
-
42
-
43
-
44
-
45
-
46
-
47
-
48
-
49
-
50
-
51
-
52
-
53
-
54
-
55
-
56
-
57
-
58
-
59
-
60
-
61
-
62
-
63
-
64
-
65
-
66
-
67
-
68
-
69
-
70
-
71
-
72
-
73
-
74
-
75
-
76
-
77
-
78
-
79
-
80
-
81
-
82
-
83
-
84
-
85
-
86
-
 87
87 -
 88
88 -
 89
89 -
 90
90 -
 91
91 -
 92
92 -
 93
93 -
 94
94 -
 95
95 -
 96
96 -
 97
97 -
 98
98 -
 99
99 -
 100
100 -
 101
101 -
 102
102 -
 103
103 -
 104
104 -
 105
105 -
 106
106 -
 107
107 -
108
-
109
-
110
-
111
-
112
-
113
-
114
-
115
-
116
-
117
-
118
-
119
-
120
-
121
-
122
-
123
-
124
-
125
-
126
-
127
-
128
-
129
-
130
-
131
-
132
-
133
-
134
-
135
-
136
-
137
-
138
-
139
-
140
-
141
-
142
-
143
-
144
-
145
-
146
-
147
-
148
-
149
-
150
-
151
-
152
-
153
-
154
-
155
-
156
-
157
-
158
-
159
-
160
-
161
-
162
-
163
-
164
-
165
-
166
-
167
-
168
-
169
-
170
-
171
-
172
-
173
-
174
-
175
-
176
-
177
-
178
-
179
-
180
-
181
-
182
-
183
-
184
-
185
-
186
-
187
-
188
-
189
-
190
-
191
-
192
-
193
-
194
-
195
-
196
-
197
-
198
-
199
-
200
-
201
-
202
-
203
-
204
-
205
-
206
-
207
-
208
-
209
-
210
-
211
-
212
-
213
-
214
-
215
-
216
-
217
-
218
-
219
-
220
-
221
 |
 |

93
!
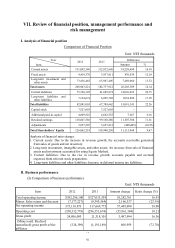
Item 2012 2011 Amount change Ratio change (%)
Realized gross profit 24,481,905 20,126,952 4,354,953 21.64
Operating expense (9,709,439) (9,403,496) (305,943) 3.25
Operating income 14,772,466 10,723,456 4,049,010 37.76
Non-operating income and gain
Interest income 196,463 160,270 36,193 22.58
Investment income (Equity
Method) 9,489,163 7,274,803 2,214,360 30.44
Dividend income 422,661 292,051 130,610 44.72
Gain from exchange 1,445,006 1,645,648 (200,642) (12.19)
Gain from financial asset
valuation 324,128 163,66 160,662 98.28
Other income 267,996 225,311 42,685 18.94
Total non-operating income
and gain 12,145,417 9,761,549 2,383,868 24.42
Non-operating expense and loss
Interest expense 5 47,099 (47,094) (99.99)
Gain on valuation of
financial liabilities, loss 76,820 522,198 (445,378) (85.29)
Other loss 127,426 120,243 7,183 5.97
Total Non-operating
expense and loss 204,251 689,540 (485,289) (70.38)
Net income before tax 26,713,632 19,795,465 6,918,167 34.95
Minus: Estimated income tax (4,291,302) (3,217,306) (1,073,996) 33.38
Net income $22,422,330 $16,578,159 5,844,171 35.25
Analysis of financial ratio change:
1. Operating income and operating cost: Both revenue and operating costs increased due to the expansion o
f
new market and launch of new products this year.
2. Non-operating income and gain: Investment earnings with equity method had increased from the year
before.
3. Other Expenses and Loss: The result was a reduction in loss on valuation of financial liability compared
with last year.
4. Estimated income tax expense: The result was an increase in income tax payable.
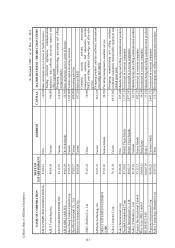
(II) Analysis of gross profit
Unit: NT$ Thousands
Change amount
Root cause
Difference of price Difference of sales
combination
Difference of
quantity
Gross profit 3,487,994 12,198,694 (9,568,006) 857,306
Remark The increase of gross profit of 2012 is from the favorable difference of price and
quantity.