Asus 2012 Annual Report Download - page 186
Download and view the complete annual report
Please find page 186 of the 2012 Asus annual report below. You can navigate through the pages in the report by either clicking on the pages listed below, or by using the keyword search tool below to find specific information within the annual report.-
 1
1 -
2
-
3
-
4
-
5
-
6
-
7
-
8
-
9
-
10
-
11
-
12
-
13
-
14
-
15
-
16
-
17
-
18
-
19
-
20
-
21
-
22
-
23
-
24
-
25
-
26
-
27
-
28
-
29
-
30
-
31
-
32
-
33
-
34
-
35
-
36
-
37
-
38
-
39
-
40
-
41
-
42
-
43
-
44
-
45
-
46
-
47
-
48
-
49
-
50
-
51
-
52
-
53
-
54
-
55
-
56
-
57
-
58
-
59
-
60
-
61
-
62
-
63
-
64
-
65
-
66
-
67
-
68
-
69
-
70
-
71
-
72
-
73
-
74
-
75
-
76
-
77
-
78
-
79
-
80
-
81
-
82
-
83
-
84
-
85
-
86
-
87
-
88
-
89
-
90
-
91
-
92
-
93
-
94
-
95
-
96
-
97
-
98
-
99
-
100
-
101
-
102
-
103
-
104
-
105
-
106
-
107
-
108
-
109
-
110
-
111
-
112
-
113
-
114
-
115
-
116
-
117
-
118
-
119
-
120
-
121
-
122
-
123
-
124
-
125
-
126
-
127
-
128
-
129
-
130
-
131
-
132
-
133
-
134
-
135
-
136
-
137
-
138
-
139
-
140
-
141
-
142
-
143
-
144
-
145
-
146
-
147
-
148
-
149
-
150
-
151
-
152
-
153
-
154
-
155
-
156
-
157
-
158
-
159
-
160
-
161
-
162
-
163
-
164
-
165
-
166
-
167
-
168
-
169
-
170
-
171
-
172
-
173
-
174
-
175
-
 176
176 -
 177
177 -
 178
178 -
 179
179 -
 180
180 -
 181
181 -
 182
182 -
 183
183 -
 184
184 -
 185
185 -
 186
186 -
 187
187 -
 188
188 -
 189
189 -
 190
190 -
 191
191 -
 192
192 -
 193
193 -
 194
194 -
 195
195 -
 196
196 -
197
-
198
-
199
-
200
-
201
-
202
-
203
-
204
-
205
-
206
-
207
-
208
-
209
-
210
-
211
-
212
-
213
-
214
-
215
-
216
-
217
-
218
-
219
-
220
-
221
 |
 |

182
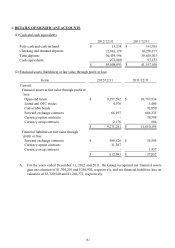
4. DETAILS OF SIGNIFICANT ACCOUNTS
(1) Cash and cash equivalents
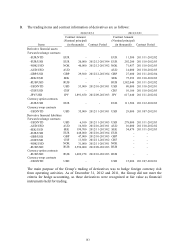
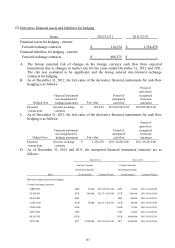
(2) Financial assets (liabilities) at fair value through profit or loss
A. For the years ended December 31, 2012 and 2011, the Group recognized net financial assets
gain on valuation of $1,704,201 and $256,902, respectively, and net financial liabilities loss on
valuation of $3,320,540 and $1,246,772, respectively.
2012/12/31 2011/12/31
Petty cash and cash on hand 13,258$ 191,765$
Checking and demand deposits 12,863,179 10,250,177
Time deposits 36,459,596 30,658,013
Cash equivalents 272,860 97,153
49,608,893$ 41,197,108$
Items 2012/12/31 2011/12/31
Current:
Financial assets at fair value through profit or
loss:
Open-end funds 9,197,592$ 10,787,934$
Listed and OTC stocks 4,976 3,404
Convertible bonds - 92,850
Forward exchange contracts 66,497 686,335
Currency option contracts - 38,788
Currency swap contracts 2,176 884
9,271,241$ 11,610,195$
Financial liabilities at fair value through
profit or loss:
Forward exchange contracts 580,526$ 35,595$
Currency option contracts 31,567 -
Currency swap contracts - 1,457
612,093$ 37,052$