Asus 2012 Annual Report Download - page 140
Download and view the complete annual report
Please find page 140 of the 2012 Asus annual report below. You can navigate through the pages in the report by either clicking on the pages listed below, or by using the keyword search tool below to find specific information within the annual report.-
 1
1 -
2
-
3
-
4
-
5
-
6
-
7
-
8
-
9
-
10
-
11
-
12
-
13
-
14
-
15
-
16
-
17
-
18
-
19
-
20
-
21
-
22
-
23
-
24
-
25
-
26
-
27
-
28
-
29
-
30
-
31
-
32
-
33
-
34
-
35
-
36
-
37
-
38
-
39
-
40
-
41
-
42
-
43
-
44
-
45
-
46
-
47
-
48
-
49
-
50
-
51
-
52
-
53
-
54
-
55
-
56
-
57
-
58
-
59
-
60
-
61
-
62
-
63
-
64
-
65
-
66
-
67
-
68
-
69
-
70
-
71
-
72
-
73
-
74
-
75
-
76
-
77
-
78
-
79
-
80
-
81
-
82
-
83
-
84
-
85
-
86
-
87
-
88
-
89
-
90
-
91
-
92
-
93
-
94
-
95
-
96
-
97
-
98
-
99
-
100
-
101
-
102
-
103
-
104
-
105
-
106
-
107
-
108
-
109
-
110
-
111
-
112
-
113
-
114
-
115
-
116
-
117
-
118
-
119
-
120
-
121
-
122
-
123
-
124
-
125
-
126
-
127
-
128
-
129
-
 130
130 -
 131
131 -
 132
132 -
 133
133 -
 134
134 -
 135
135 -
 136
136 -
 137
137 -
 138
138 -
 139
139 -
 140
140 -
 141
141 -
 142
142 -
 143
143 -
 144
144 -
 145
145 -
 146
146 -
 147
147 -
 148
148 -
 149
149 -
 150
150 -
151
-
152
-
153
-
154
-
155
-
156
-
157
-
158
-
159
-
160
-
161
-
162
-
163
-
164
-
165
-
166
-
167
-
168
-
169
-
170
-
171
-
172
-
173
-
174
-
175
-
176
-
177
-
178
-
179
-
180
-
181
-
182
-
183
-
184
-
185
-
186
-
187
-
188
-
189
-
190
-
191
-
192
-
193
-
194
-
195
-
196
-
197
-
198
-
199
-
200
-
201
-
202
-
203
-
204
-
205
-
206
-
207
-
208
-
209
-
210
-
211
-
212
-
213
-
214
-
215
-
216
-
217
-
218
-
219
-
220
-
221
 |
 |

136
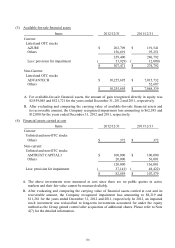
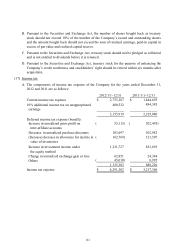
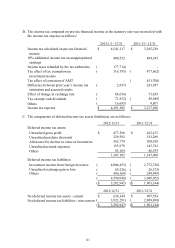
(3) Available-for-sale financial assets
A. For available-for-sale financial assets, the amount of gain recognized directly in equity was
$2,959,045 and $521,721 for the years ended December 31, 2012 and 2011, respectively.
B. After evaluating and comparing the carrying value of available-for-sale financial assets and
its recoverable amount, the Company recognized impairment loss amounting to $62,585 and
$12,000 for the years ended December 31, 2012 and 2011, respectively.
(4) Financial assets carried at cost
A. The above investments were measured at cost since there are no public quotes in active
markets and their fair value cannot be measured reliably.
B. After evaluating and comparing the carrying value of financial assets carried at cost and its
recoverable amount, the Company recognized impairment loss amounting to $8,219 and
$11,281 for the years ended December 31, 2012 and 2011, respectively. In 2012, an impaired
stock investment was reclassified to long-term investments accounted for under the equity
method as the Group gained control after acquisition of additional shares. Please refer to Note
4(7) for the detailed information.
Items 2012/12/31 2011/12/31
Current:
Listed and OTC stocks
AZURE 202,709$ 191,541$
Others 156,691 95,251
359,400 286,792
Less: provision for impairment 51,929)( 12,000)(
307,471$ 274,792$
Non-Current:
Listed and OTC stocks
ADVANTECH 10,255,695$ 7,015,732$
Others - 52,607
10,255,695$ 7,068,339$
Items 2012/12/31 2011/12/31
Current:
Unlisted and non-OTC stocks
Others 372$ 372$
Non-current:
Unlisted and non-OTC stocks
AMTRUST CAPITAL I 100,000$ 100,000$
Others 20,000 56,001
120,000 156,001
Less: provision for impairment 37,141)( 48,422)(
82,859$ 107,579$