Asus 2012 Annual Report Download - page 168
Download and view the complete annual report
Please find page 168 of the 2012 Asus annual report below. You can navigate through the pages in the report by either clicking on the pages listed below, or by using the keyword search tool below to find specific information within the annual report.-
 1
1 -
2
-
3
-
4
-
5
-
6
-
7
-
8
-
9
-
10
-
11
-
12
-
13
-
14
-
15
-
16
-
17
-
18
-
19
-
20
-
21
-
22
-
23
-
24
-
25
-
26
-
27
-
28
-
29
-
30
-
31
-
32
-
33
-
34
-
35
-
36
-
37
-
38
-
39
-
40
-
41
-
42
-
43
-
44
-
45
-
46
-
47
-
48
-
49
-
50
-
51
-
52
-
53
-
54
-
55
-
56
-
57
-
58
-
59
-
60
-
61
-
62
-
63
-
64
-
65
-
66
-
67
-
68
-
69
-
70
-
71
-
72
-
73
-
74
-
75
-
76
-
77
-
78
-
79
-
80
-
81
-
82
-
83
-
84
-
85
-
86
-
87
-
88
-
89
-
90
-
91
-
92
-
93
-
94
-
95
-
96
-
97
-
98
-
99
-
100
-
101
-
102
-
103
-
104
-
105
-
106
-
107
-
108
-
109
-
110
-
111
-
112
-
113
-
114
-
115
-
116
-
117
-
118
-
119
-
120
-
121
-
122
-
123
-
124
-
125
-
126
-
127
-
128
-
129
-
130
-
131
-
132
-
133
-
134
-
135
-
136
-
137
-
138
-
139
-
140
-
141
-
142
-
143
-
144
-
145
-
146
-
147
-
148
-
149
-
150
-
151
-
152
-
153
-
154
-
155
-
156
-
157
-
 158
158 -
 159
159 -
 160
160 -
 161
161 -
 162
162 -
 163
163 -
 164
164 -
 165
165 -
 166
166 -
 167
167 -
 168
168 -
 169
169 -
 170
170 -
 171
171 -
 172
172 -
 173
173 -
 174
174 -
 175
175 -
 176
176 -
 177
177 -
 178
178 -
179
-
180
-
181
-
182
-
183
-
184
-
185
-
186
-
187
-
188
-
189
-
190
-
191
-
192
-
193
-
194
-
195
-
196
-
197
-
198
-
199
-
200
-
201
-
202
-
203
-
204
-
205
-
206
-
207
-
208
-
209
-
210
-
211
-
212
-
213
-
214
-
215
-
216
-
217
-
218
-
219
-
220
-
221
 |
 |

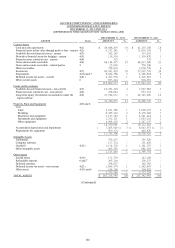
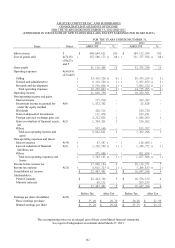
164
ASUSTEK COMPUTER INC. AND SUBSIDIARIES
CONSOLIDATED STATEMENTS OF CASH FLOWS
FOR THE YEARS ENDED DECEMBER 31, 2012 AND 2011
(EXPRESSED IN THOUSANDS OF NEW TAIWAN DOLLARS)
FOR THE YEARS ENDED DECEMBER 31,
2012
2011
Cash flows from operating activities
Consolidated net income
$
22,487,461
$
16,847,398
Adjustments to reconcile consolidated net income to net cash provided by
operating activities
Depreciation, amortization and impairment
2,641,605
2,791,970
Cash dividends received from long-term equity investments accounted for under
the equity method
21,125
812,310
Investment income accounted for under the equity method
(
1,472,762
)
(
24,826
)
Gain on disposal of investments
(
111,478
)
(
429,491
)
Changes in assets and liabilities
Financial assets at fair value through profit or loss - current
2,314,979
(
890,981
)
Notes and accounts receivable (including related parties)
(
16,850,696
)
(
7,696,757
)
Other receivables
6,534,599
(
5,867,219
)
Inventories
(
22,123,925
)
(
11,800,519
)
Prepayments
(
828,976
)
2,885,078
Other current assets
(
64,683
)
(
495,778
)
Financial liabilities at fair value through profit or loss - current
586,271
(
228,126
)
Notes and accounts payable (including related parties)
11,818,102
3,046,228
Income tax payable
1,061,678
422,609
Accrued expenses
16,102,586
7,887,904
Receipts in advance
(
897,384
)
6,104,282
Other current liabilities
616,292
4,844,173
Deferred income tax assets and liabilities
240,348
(
77,135
)
Others
120,101
345,926
Net cash provided by operating activities
22,195,243
18,477,046
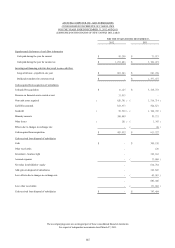
Cash flows from investing activities
Increase in funds and investments
(
143,902
)
(
551,383
)
Proceeds from disposal of funds and investments
140,119
616,098
Acquisition of property, plant and equipment
(
2,951,492
)
(
2,525,073
)
Proceeds from disposal of leased assets
-
222,616
Decrease in intangible assets and deferred expenses
(
258,678
)
(
199,940
)
Acquisition of subsidiaries
(
11,125
)
(
5,000,097
)
Proceeds from disposal of subsidiaries
-
747,404
Others
(
13,591
)
(
40,239
)
Net cash used in investing activities
(
3,238,669
)
(
6,730,614
)
Cash flows from financing activities
Increase (decrease) in short-term loans
766,086
(
1,039,507
)
Redemption of bonds payable
-
(
2,459,400
)
Increase in long-term loans
85,970
288,393
Redemption of long-term loans
(
75,251
)
(
299,986
)
Redemption of treasury stock
-
(
2,609,422
)
Payment of cash dividends
(
10,915,024
)
(
8,638,233
)
Changes in minority interests
360,547
1,519,071
Others
31,975
(
5,932
)
Net cash used in financing activities
(
9,745,697
)
(
13,245,016
)
Effects due to changes in exchange rate
(
1,171,042
)
641,780
Effects due to changes in consolidated subsidiaries
(
34,002
)
(
306,150
)
Effects due to cash acquired from acquisition of subsidiaries
405,952
613,522
Increase (decrease) in cash and cash equivalents
8,411,785
(
549,432
)
Cash and cash equivalents at beginning of the year
41,197,108
41,746,540
Cash and cash equivalents at end of the year
$
49,608,893
$
41,197,108
(Continued)