Asus 2012 Annual Report Download - page 210
Download and view the complete annual report
Please find page 210 of the 2012 Asus annual report below. You can navigate through the pages in the report by either clicking on the pages listed below, or by using the keyword search tool below to find specific information within the annual report.-
 1
1 -
2
-
3
-
4
-
5
-
6
-
7
-
8
-
9
-
10
-
11
-
12
-
13
-
14
-
15
-
16
-
17
-
18
-
19
-
20
-
21
-
22
-
23
-
24
-
25
-
26
-
27
-
28
-
29
-
30
-
31
-
32
-
33
-
34
-
35
-
36
-
37
-
38
-
39
-
40
-
41
-
42
-
43
-
44
-
45
-
46
-
47
-
48
-
49
-
50
-
51
-
52
-
53
-
54
-
55
-
56
-
57
-
58
-
59
-
60
-
61
-
62
-
63
-
64
-
65
-
66
-
67
-
68
-
69
-
70
-
71
-
72
-
73
-
74
-
75
-
76
-
77
-
78
-
79
-
80
-
81
-
82
-
83
-
84
-
85
-
86
-
87
-
88
-
89
-
90
-
91
-
92
-
93
-
94
-
95
-
96
-
97
-
98
-
99
-
100
-
101
-
102
-
103
-
104
-
105
-
106
-
107
-
108
-
109
-
110
-
111
-
112
-
113
-
114
-
115
-
116
-
117
-
118
-
119
-
120
-
121
-
122
-
123
-
124
-
125
-
126
-
127
-
128
-
129
-
130
-
131
-
132
-
133
-
134
-
135
-
136
-
137
-
138
-
139
-
140
-
141
-
142
-
143
-
144
-
145
-
146
-
147
-
148
-
149
-
150
-
151
-
152
-
153
-
154
-
155
-
156
-
157
-
158
-
159
-
160
-
161
-
162
-
163
-
164
-
165
-
166
-
167
-
168
-
169
-
170
-
171
-
172
-
173
-
174
-
175
-
176
-
177
-
178
-
179
-
180
-
181
-
182
-
183
-
184
-
185
-
186
-
187
-
188
-
189
-
190
-
191
-
192
-
193
-
194
-
195
-
196
-
197
-
198
-
199
-
 200
200 -
 201
201 -
 202
202 -
 203
203 -
 204
204 -
 205
205 -
 206
206 -
 207
207 -
 208
208 -
 209
209 -
 210
210 -
 211
211 -
 212
212 -
 213
213 -
 214
214 -
 215
215 -
 216
216 -
 217
217 -
 218
218 -
 219
219 -
 220
220 -
221
 |
 |

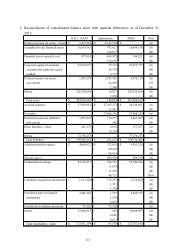
206
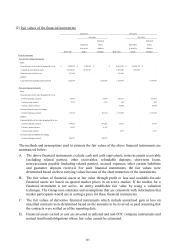
E. The fair value of long-term loans was estimated by the discounted value of expected cash flow.
The discount rate used was based on the interest rate of long-term loans with similar
conditions. Based on the results of the evaluation, the fair value is close to book value.
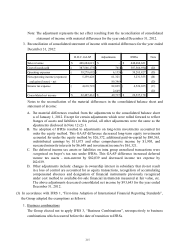
(3) Procedure of financial risk control
The Group can effectively control to attain optimum risk positions, maintain appropriate liquidity
positions and centralize management of significant market risks after appropriately taking into
consideration the economic environment, competition, and changes of market value risk by setting
the goal of risk management.
(4) Information of material financial risk
A. Market risk
(A) The main currency for purchases and sales of the Group is the US dollar. The Group uses
the principle of natural hedge to mitigate the risk and utilizes spot or forward contracts,
currency swap and currency option contracts to hedge foreign currency risk. The forward
exchange, currency swap and currency option contracts’ duration corresponds to the
Group’s foreign currency assets’ and liabilities’ due date and future cash flows. The
exchange gain and loss resulting from foreign currency assets and liabilities will be
offset by the exchange gain and loss resulting from the hedged item.
(B) The open-end funds and listed and OTC stocks held by the Group are classified as
financial assets at fair value through profit or loss and available-for-sale financial assets.
As these assets are measured at fair value, the Group has risk exposure related to
changes in fair value in an equity securities market.
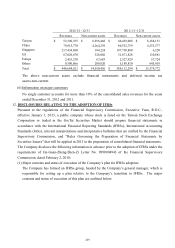
(C) Information on significant foreign currency denominated assets and liabilities:
B. Credit risk
(A) Credit risk means the potential loss of the Group if the counterparty involved in the
transaction defaults. Since the Group’s derivative financial instrument agreements are
entered into with international financial institutions with good credit ratings,
management believes that there is no significant credit risk from these transactions.
(B) The primary potential credit risk is from financial instruments like cash, bank deposits,
equity securities under non-equity method, and accounts receivable. The Group deposits
cash in different financial institutions. Equity securities under non-equity method are
Foreign Currency Foreign Currency
(in dollars) Rate NTD (in dollars) Rate NTD
Financial assets
Monetary item
USD
1,402,498,690$ 29.04 40,728,562$ 911,800,716$ 30.275 27,604,767$
EUR
280,557,498 38.49 10,798,658 351,013,985 39.18 13,752,728
RMB 1,926,254,257 4.6611 8,978,464 5,669,965,355 4.8101 27,273,100
Financial liabilities
Monetary item
USD
3,528,632,681 29.04 102,471,493 2,083,890,167 30.275 63,089,775
RMB 1,465,148,387 4.6611 6,829,203 1,337,789,905 4.8101 6,434,903
2012/12/31
2011/12/31