Asus 2012 Annual Report Download - page 160
Download and view the complete annual report
Please find page 160 of the 2012 Asus annual report below. You can navigate through the pages in the report by either clicking on the pages listed below, or by using the keyword search tool below to find specific information within the annual report.-
 1
1 -
2
-
3
-
4
-
5
-
6
-
7
-
8
-
9
-
10
-
11
-
12
-
13
-
14
-
15
-
16
-
17
-
18
-
19
-
20
-
21
-
22
-
23
-
24
-
25
-
26
-
27
-
28
-
29
-
30
-
31
-
32
-
33
-
34
-
35
-
36
-
37
-
38
-
39
-
40
-
41
-
42
-
43
-
44
-
45
-
46
-
47
-
48
-
49
-
50
-
51
-
52
-
53
-
54
-
55
-
56
-
57
-
58
-
59
-
60
-
61
-
62
-
63
-
64
-
65
-
66
-
67
-
68
-
69
-
70
-
71
-
72
-
73
-
74
-
75
-
76
-
77
-
78
-
79
-
80
-
81
-
82
-
83
-
84
-
85
-
86
-
87
-
88
-
89
-
90
-
91
-
92
-
93
-
94
-
95
-
96
-
97
-
98
-
99
-
100
-
101
-
102
-
103
-
104
-
105
-
106
-
107
-
108
-
109
-
110
-
111
-
112
-
113
-
114
-
115
-
116
-
117
-
118
-
119
-
120
-
121
-
122
-
123
-
124
-
125
-
126
-
127
-
128
-
129
-
130
-
131
-
132
-
133
-
134
-
135
-
136
-
137
-
138
-
139
-
140
-
141
-
142
-
143
-
144
-
145
-
146
-
147
-
148
-
149
-
 150
150 -
 151
151 -
 152
152 -
 153
153 -
 154
154 -
 155
155 -
 156
156 -
 157
157 -
 158
158 -
 159
159 -
 160
160 -
 161
161 -
 162
162 -
 163
163 -
 164
164 -
 165
165 -
 166
166 -
 167
167 -
 168
168 -
 169
169 -
 170
170 -
171
-
172
-
173
-
174
-
175
-
176
-
177
-
178
-
179
-
180
-
181
-
182
-
183
-
184
-
185
-
186
-
187
-
188
-
189
-
190
-
191
-
192
-
193
-
194
-
195
-
196
-
197
-
198
-
199
-
200
-
201
-
202
-
203
-
204
-
205
-
206
-
207
-
208
-
209
-
210
-
211
-
212
-
213
-
214
-
215
-
216
-
217
-
218
-
219
-
220
-
221
 |
 |

156
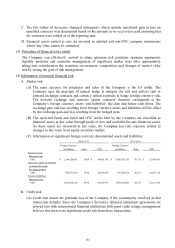
C. The fair values of derivative financial instruments which include unrealized gain or loss on
unsettled contracts were determined based on the amounts to be received or paid assuming that
the contracts were settled as of the reporting date.
D. Financial assets carried at cost are invested in unlisted and non-OTC company instruments
whose fair value cannot be estimated.
(3) Procedure of financial risk control
The Company can effectively control to attain optimum risk positions, maintain appropriate
liquidity positions and centralize management of significant market risks after appropriately
taking into consideration the economic environment, competition, and changes of market value
risk by setting the goal of risk management.
(4) Information of material financial risk
A. Market risk
(A) The main currency for purchases and sales of the Company is the US dollar. The
Company uses the principle of natural hedge to mitigate the risk and utilizes spot or
forward exchange contracts and currency option contracts to hedge foreign currency risk.
The forward exchange and currency option contracts’ duration corresponds to the
Company’s foreign currency assets’ and liabilities’ due date and future cash flows. The
exchange gain and loss resulting from foreign currency assets and liabilities will be offset
by the exchange gain and loss resulting from the hedged item.
(B) The open-end funds and listed and OTC stocks held by the Company are classified as
financial assets at fair value through profit or loss and available-for-sale financial assets.
As these assets are measured at fair value, the Company has risk exposure related to
changes in fair value in an equity securities market.
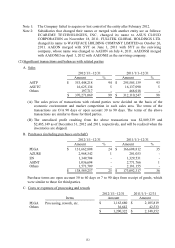
(C) Information on significant foreign currency denominated assets and liabilities:
B. Credit risk
(A) Credit risk means the potential loss of the Company if the counterparty involved in that
transaction defaults. Since the Company’s derivative financial instrument agreements are
entered into with international financial institutions with good credit ratings, management
believes that there is no significant credit risk from these transactions.
Foreign Currency Foreign Currency
(in dollars) Rate NTD (in dollars) Rate NTD
Financial assets
Monetary item
USD 2,344,550,492$ 29.04 68,085,746$ 2,069,185,553$ 30.275 62,644,593$
Long-term equity investments
accounted for under
the equity method
USD 860,573,539 29.04 24,991,056 663,488,476 30.275 20,087,114
Financial liabilities
Monetary item
USD 2,247,038,314 29.04 65,253,993 1,692,874,003 30.275 51,251,760
2012/12/31
2011/12/31