Asus 2012 Annual Report Download - page 191
Download and view the complete annual report
Please find page 191 of the 2012 Asus annual report below. You can navigate through the pages in the report by either clicking on the pages listed below, or by using the keyword search tool below to find specific information within the annual report.-
 1
1 -
2
-
3
-
4
-
5
-
6
-
7
-
8
-
9
-
10
-
11
-
12
-
13
-
14
-
15
-
16
-
17
-
18
-
19
-
20
-
21
-
22
-
23
-
24
-
25
-
26
-
27
-
28
-
29
-
30
-
31
-
32
-
33
-
34
-
35
-
36
-
37
-
38
-
39
-
40
-
41
-
42
-
43
-
44
-
45
-
46
-
47
-
48
-
49
-
50
-
51
-
52
-
53
-
54
-
55
-
56
-
57
-
58
-
59
-
60
-
61
-
62
-
63
-
64
-
65
-
66
-
67
-
68
-
69
-
70
-
71
-
72
-
73
-
74
-
75
-
76
-
77
-
78
-
79
-
80
-
81
-
82
-
83
-
84
-
85
-
86
-
87
-
88
-
89
-
90
-
91
-
92
-
93
-
94
-
95
-
96
-
97
-
98
-
99
-
100
-
101
-
102
-
103
-
104
-
105
-
106
-
107
-
108
-
109
-
110
-
111
-
112
-
113
-
114
-
115
-
116
-
117
-
118
-
119
-
120
-
121
-
122
-
123
-
124
-
125
-
126
-
127
-
128
-
129
-
130
-
131
-
132
-
133
-
134
-
135
-
136
-
137
-
138
-
139
-
140
-
141
-
142
-
143
-
144
-
145
-
146
-
147
-
148
-
149
-
150
-
151
-
152
-
153
-
154
-
155
-
156
-
157
-
158
-
159
-
160
-
161
-
162
-
163
-
164
-
165
-
166
-
167
-
168
-
169
-
170
-
171
-
172
-
173
-
174
-
175
-
176
-
177
-
178
-
179
-
180
-
 181
181 -
 182
182 -
 183
183 -
 184
184 -
 185
185 -
 186
186 -
 187
187 -
 188
188 -
 189
189 -
 190
190 -
 191
191 -
 192
192 -
 193
193 -
 194
194 -
 195
195 -
 196
196 -
 197
197 -
 198
198 -
 199
199 -
 200
200 -
 201
201 -
202
-
203
-
204
-
205
-
206
-
207
-
208
-
209
-
210
-
211
-
212
-
213
-
214
-
215
-
216
-
217
-
218
-
219
-
220
-
221
 |
 |

187
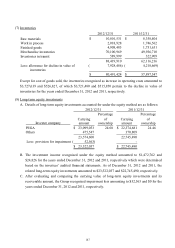
(7) Inventories
Except for cost of goods sold, the inventories recognized as increase in operating costs amounted to
$3,727,639 and $526,827, of which $3,721,480 and $515,850 pertain to the decline in value of
inventories for the years ended December 31, 2012 and 2011, respectively.
(8) Long-term equity investments
A. Details of long-term equity investments accounted for under the equity method are as follows:
B. The investment income recognized under the equity method amounted to $1,472,762 and
$24,826 for the years ended December 31, 2012 and 2011, respectively which were determined
based on the investees’ audited financial statements. As of December 31, 2012 and 2011, the
related long-term equity investments amounted to $23,522,037 and $22,745,490, respectively.
C. After evaluating and comparing the carrying value of long-term equity investments and its
recoverable amount, the Group recognized impairment loss amounting to $52,563 and $0 for the
years ended December 31, 2012 and 2011, respectively.
2012/12/31 2011/12/31
Raw materials 10,801,531$ 8,358,404$
Work in process 2,018,928 1,746,562
Finished goods 4,908,483 1,751,631
Merchandise inventories 70,100,969 49,936,710
Inventories in transit 589,999 322,909
88,419,910 62,116,216
Less: allowance for decline in value of 7,928,486)( 4,218,669)(
inventories
80,491,424$ 57,897,547$
Percentage Percentage
Carrying of Carrying of
Investee company amount ownership amount ownership
PEGA 23,099,053$ 24.08 22,374,681$ 24.46
Others 475,547 370,809
23,574,600 22,745,490
Less: provision for impairment 52,563)( -
23,522,037$ 22,745,490$
2012/12/31
2011/12/31