Asus 2012 Annual Report Download - page 93
Download and view the complete annual report
Please find page 93 of the 2012 Asus annual report below. You can navigate through the pages in the report by either clicking on the pages listed below, or by using the keyword search tool below to find specific information within the annual report.-
 1
1 -
2
-
3
-
4
-
5
-
6
-
7
-
8
-
9
-
10
-
11
-
12
-
13
-
14
-
15
-
16
-
17
-
18
-
19
-
20
-
21
-
22
-
23
-
24
-
25
-
26
-
27
-
28
-
29
-
30
-
31
-
32
-
33
-
34
-
35
-
36
-
37
-
38
-
39
-
40
-
41
-
42
-
43
-
44
-
45
-
46
-
47
-
48
-
49
-
50
-
51
-
52
-
53
-
54
-
55
-
56
-
57
-
58
-
59
-
60
-
61
-
62
-
63
-
64
-
65
-
66
-
67
-
68
-
69
-
70
-
71
-
72
-
73
-
74
-
75
-
76
-
77
-
78
-
79
-
80
-
81
-
82
-
 83
83 -
 84
84 -
 85
85 -
 86
86 -
 87
87 -
 88
88 -
 89
89 -
 90
90 -
 91
91 -
 92
92 -
 93
93 -
 94
94 -
 95
95 -
 96
96 -
 97
97 -
 98
98 -
 99
99 -
 100
100 -
 101
101 -
 102
102 -
 103
103 -
104
-
105
-
106
-
107
-
108
-
109
-
110
-
111
-
112
-
113
-
114
-
115
-
116
-
117
-
118
-
119
-
120
-
121
-
122
-
123
-
124
-
125
-
126
-
127
-
128
-
129
-
130
-
131
-
132
-
133
-
134
-
135
-
136
-
137
-
138
-
139
-
140
-
141
-
142
-
143
-
144
-
145
-
146
-
147
-
148
-
149
-
150
-
151
-
152
-
153
-
154
-
155
-
156
-
157
-
158
-
159
-
160
-
161
-
162
-
163
-
164
-
165
-
166
-
167
-
168
-
169
-
170
-
171
-
172
-
173
-
174
-
175
-
176
-
177
-
178
-
179
-
180
-
181
-
182
-
183
-
184
-
185
-
186
-
187
-
188
-
189
-
190
-
191
-
192
-
193
-
194
-
195
-
196
-
197
-
198
-
199
-
200
-
201
-
202
-
203
-
204
-
205
-
206
-
207
-
208
-
209
-
210
-
211
-
212
-
213
-
214
-
215
-
216
-
217
-
218
-
219
-
220
-
221
 |
 |

89
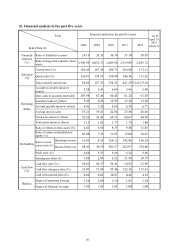
The root causes of the financial ratio change in the last two years:
Times interest earned ratio: The interest expense decreased due to the expiration of CB from last year, therefore the
interest coverage ratio is increased.
Ratio of return on assets: Due to the increase in net operating profit after tax for the current year, the return on
assets increased.
Ratio of return on shareholders’ equity: The increase in net profits caused the increase in ROE.
Ratio of operating income to issued capital stock: The increase in operating profit this year caused the operating
income to capital stock ratio to rise.
Ratio of net income before tax to issued capital stock: The increase in net income before tax this year caused the net
income before tax to issued capital stock to rise.
Cash flow ratio: The increase in cash inflow from operating activities was greater than the account payables and
expenses for inbound material inventory as well as other current liabilities, therefore the cash flow ratio incrased.
Cash reinvestment ratio: Due to the revenue growth this year, the net cash inflow from operating activities increased
and therefore the cash re-investment ratio increased.
Note 1: The financial information is reviewed by CPA.
Note 2: Accounts receivable includes the amount of long-term accounts receivable- related party that is in
compliance with trade terms and conditions.
Note 3: The 2013Q1 financial statements have not yet been audited by CPA up to the date of the report
printed on April 19, 2013.
Note 4: Equations:
1. Financial structure
(1) Ratio of liabilities to assets = Total liability/Total assets
(2) Ratio of long-Term capital to fixed assets = (Net shareholders’ equity + Long-term liability)
/ Net fixed assets
2. Solvency
(1) Current ratio = Current assets / current liability
(2) Quick ratio = (Current assets – Inventory – Prepaid expense) / Current liability
(3) Times interest earned ratio = Net income before tax and interest expense / Interest expense
of the year
3. Operating ability
(1) Account receivable turnover (including accounts receivable and notes receivable derived
from business operation) = Net sales / Average accounts receivable (including accounts
receivable and notes receivable derived from business operation)
(2) Days sales in accounts receivable = 365 / Account receivable turnover
(3) Inventory turnover = Cost of goods sold / Average inventory amount
(4) Account payable turnover (including accounts payable and notes payable derived from
business operation) = Cost of goods sold/ Average accounts payable (including accounts
payable and notes payable derived from business operation)
(5) Average days in sales = 365 / Inventory turnover
(6) Fixed assts turnover = Net sales / Net fixed assets
(7) Total assets turnover = Net sales / Total assets
4. Profitability
(1) Return on assets = [Net income (loss) + interest expense x (1-tax rate)] / Average total assets
(2) Return on shareholder’s equity = Net income (loss) / Net average shareholders’ equity
(3) Ratio to issued capital stock = Net income before tax / Issued capital stock
(4) Profit ratio = Net income (loss) / Net sales
(5) Earnings per share = (Net income – preferred stock dividend) / Weighted average stock
shares issued
5. Cash flow
(1) Cash flow ratio = Net cash flow from operating activity / Current liability
(2) Cash flow adequacy ratio = Net cash flow from operating activity in the past five years /