Asus 2012 Annual Report Download - page 166
Download and view the complete annual report
Please find page 166 of the 2012 Asus annual report below. You can navigate through the pages in the report by either clicking on the pages listed below, or by using the keyword search tool below to find specific information within the annual report.-
 1
1 -
2
-
3
-
4
-
5
-
6
-
7
-
8
-
9
-
10
-
11
-
12
-
13
-
14
-
15
-
16
-
17
-
18
-
19
-
20
-
21
-
22
-
23
-
24
-
25
-
26
-
27
-
28
-
29
-
30
-
31
-
32
-
33
-
34
-
35
-
36
-
37
-
38
-
39
-
40
-
41
-
42
-
43
-
44
-
45
-
46
-
47
-
48
-
49
-
50
-
51
-
52
-
53
-
54
-
55
-
56
-
57
-
58
-
59
-
60
-
61
-
62
-
63
-
64
-
65
-
66
-
67
-
68
-
69
-
70
-
71
-
72
-
73
-
74
-
75
-
76
-
77
-
78
-
79
-
80
-
81
-
82
-
83
-
84
-
85
-
86
-
87
-
88
-
89
-
90
-
91
-
92
-
93
-
94
-
95
-
96
-
97
-
98
-
99
-
100
-
101
-
102
-
103
-
104
-
105
-
106
-
107
-
108
-
109
-
110
-
111
-
112
-
113
-
114
-
115
-
116
-
117
-
118
-
119
-
120
-
121
-
122
-
123
-
124
-
125
-
126
-
127
-
128
-
129
-
130
-
131
-
132
-
133
-
134
-
135
-
136
-
137
-
138
-
139
-
140
-
141
-
142
-
143
-
144
-
145
-
146
-
147
-
148
-
149
-
150
-
151
-
152
-
153
-
154
-
155
-
 156
156 -
 157
157 -
 158
158 -
 159
159 -
 160
160 -
 161
161 -
 162
162 -
 163
163 -
 164
164 -
 165
165 -
 166
166 -
 167
167 -
 168
168 -
 169
169 -
 170
170 -
 171
171 -
 172
172 -
 173
173 -
 174
174 -
 175
175 -
 176
176 -
177
-
178
-
179
-
180
-
181
-
182
-
183
-
184
-
185
-
186
-
187
-
188
-
189
-
190
-
191
-
192
-
193
-
194
-
195
-
196
-
197
-
198
-
199
-
200
-
201
-
202
-
203
-
204
-
205
-
206
-
207
-
208
-
209
-
210
-
211
-
212
-
213
-
214
-
215
-
216
-
217
-
218
-
219
-
220
-
221
 |
 |

162
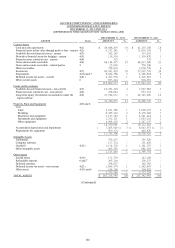
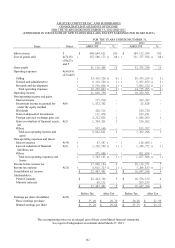
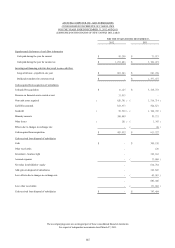
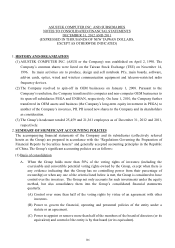
ASUSTEK COMPUTER INC. AND SUBSIDIARIES
CONSOLIDATED STATEMENTS OF INCOME
FOR THE YEARS ENDED DECEMBER 31, 2012 AND 2011
(EXPRESSED IN THOUSANDS OF NEW TAIWAN DOLLARS, EXCEPT EARNINGS PER SHARE DATA)
FOR THE YEARS ENDED DECEMBER 31,
2012
2011
Items
Notes
AMOUNT
%
AMOUNT
%
The accompanying notes are an integral part of these consolidated financial statements.
See report of independent accountants dated March 27, 2013.
Sales revenue
5
$
448,684,621
100
$
384,112,294
100
Cost of goods sold
4(7)(16)
(19)(23)
and 5
(
387,566,173
)
(
86
)
(
331,757,508
)
(
86
)
Gross profit
61,118,448
14
52,354,786
14
Operating expenses
4(16)(19)
(23) and 5
Selling
(
24,430,524
)
(
6
)
(
20,479,104
)
(
5
)
General and administrative
(
6,310,520
)
(
1
)
(
5,953,859
)
(
2
)
Research and development
(
8,538,648
)
(
2
)
(
7,692,322
)
(
2
)
Total operating expenses
(
39,279,692
)
(
9
)
(
34,125,285
)
(
9
)
Operating income
21,838,756
5
18,229,501
5
Non-operating income and gains
Interest income
515,918
-
369,387
-
Investment income accounted for
under the equity method
4(8)
1,472,762
-
24,826
-
Dividends
428,514
-
320,720
-
Gain on disposal of investments
111,478
-
429,491
-
Foreign currency exchange gain, net
4,212,602
1
1,848,263
1
Gain on valuation of financial assets,
net
4(2)
1,704,201
1
256,902
-
Others
597,146
-
532,707
-
Total non-operating income and
gains
9,042,621
2
3,782,296
1
Non-operating expenses and losses
Interest expense
4(14)
(
87,587
)
-
(
128,960
)
-
Loss on valuation of financial
liabilities, net
4(2)
(
3,320,540
)
(
1
)
(
1,246,772
)
(
1
)
Others
(
375,066
)
-
(
501,834
)
-
Total non-operating expenses and
losses
(
3,783,193
)
(
1
)
(
1,877,566
)
(
1
)
Income before income tax
27,098,184
6
20,134,231
5
Income tax expense
4(21)
(
4,610,723
)
(
1
)
(
3,286,833
)
(
1
)
Consolidated net income
$
22,487,461
5
$
16,847,398
4
Attributable to:
Parent Company
$
22,422,330
5
$
16,578,159
4
Minority interests
65,131
-
269,239
-
$
22,487,461
5
$
16,847,398
4
Before Tax
After Tax
Before Tax
After Tax
Earnings per share (In dollars)
4(22)
Basic earnings per share
$
35.49
$
29.79
$
26.26
$
21.99
Diluted earnings per share
$
35.29
$
29.62
$
25.75
$
21.55