APS 2013 Annual Report Download - page 97
Download and view the complete annual report
Please find page 97 of the 2013 APS annual report below. You can navigate through the pages in the report by either clicking on the pages listed below, or by using the keyword search tool below to find specific information within the annual report.-
 1
1 -
2
-
3
-
4
-
5
-
6
-
7
-
8
-
9
-
10
-
11
-
12
-
13
-
14
-
15
-
16
-
17
-
18
-
19
-
20
-
21
-
22
-
23
-
24
-
25
-
26
-
27
-
28
-
29
-
30
-
31
-
32
-
33
-
34
-
35
-
36
-
37
-
38
-
39
-
40
-
41
-
42
-
43
-
44
-
45
-
46
-
47
-
48
-
49
-
50
-
51
-
52
-
53
-
54
-
55
-
56
-
57
-
58
-
59
-
60
-
61
-
62
-
63
-
64
-
65
-
66
-
67
-
68
-
69
-
70
-
71
-
72
-
73
-
74
-
75
-
76
-
77
-
78
-
79
-
80
-
81
-
82
-
83
-
84
-
85
-
86
-
 87
87 -
 88
88 -
 89
89 -
 90
90 -
 91
91 -
 92
92 -
 93
93 -
 94
94 -
 95
95 -
 96
96 -
 97
97 -
 98
98 -
 99
99 -
 100
100 -
 101
101 -
 102
102 -
 103
103 -
 104
104 -
 105
105 -
 106
106 -
 107
107 -
108
-
109
-
110
-
111
-
112
-
113
-
114
-
115
-
116
-
117
-
118
-
119
-
120
-
121
-
122
-
123
-
124
-
125
-
126
-
127
-
128
-
129
-
130
-
131
-
132
-
133
-
134
-
135
-
136
-
137
-
138
-
139
-
140
-
141
-
142
-
143
-
144
-
145
-
146
-
147
-
148
-
149
-
150
-
151
-
152
-
153
-
154
-
155
-
156
-
157
-
158
-
159
-
160
-
161
-
162
-
163
-
164
-
165
-
166
-
167
-
168
-
169
-
170
-
171
-
172
-
173
-
174
-
175
-
176
-
177
-
178
-
179
-
180
-
181
-
182
-
183
-
184
-
185
-
186
-
187
-
188
-
189
-
190
-
191
-
192
-
193
-
194
-
195
-
196
-
197
-
198
-
199
-
200
-
201
-
202
-
203
-
204
-
205
-
206
-
207
-
208
-
209
-
210
-
211
-
212
-
213
-
214
-
215
-
216
-
217
-
218
-
219
-
220
-
221
-
222
-
223
-
224
-
225
-
226
-
227
-
228
-
229
-
230
-
231
-
232
-
233
-
234
-
235
-
236
-
237
-
238
-
239
-
240
-
241
-
242
-
243
-
244
-
245
-
246
-
247
-
248
-
249
-
250
-
251
-
252
-
253
-
254
-
255
-
256
-
257
-
258
-
259
-
260
-
261
-
262
-
263
-
264
-
265
-
266
 |
 |

Table of Contents
PINNACLE WEST CAPITAL CORPORATION
NOTES TO CONSOLIDATED FINANCIAL STATEMENTS
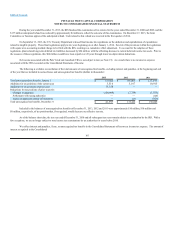
Intangible Assets
We have no goodwill recorded and have separately disclosed other intangible assets, primarily APS’s software, on Pinnacle West’s Consolidated
Balance Sheets. The intangible assets are amortized over their finite useful lives. Amortization expense was $53 million in 2013, $50 million in 2012, and
$47 million in 2011. Estimated amortization expense on existing intangible assets over the next five years is $47 million in 2014, $38 million in 2015, $29
million in 2016, $19 million in 2017, and $7 million in 2018. At December 31, 2013, the weighted-average remaining amortization period for intangible
assets was 6 years.
Investments
El Dorado accounts for its investments using either the equity method (if significant influence) or the cost method (if less than 20% ownership).
Our investments in the nuclear decommissioning trust fund are accounted for in accordance with guidance on accounting for certain investments in
debt and equity securities. See Note 14 and Note 20 for more information on these investments.
Business Segments
Pinnacle West’s reportable business segment is our regulated electricity segment, which consists of traditional regulated retail and wholesale electricity
businesses (primarily electricity service to Native Load customers) and related activities and includes electricity generation, transmission and distribution. All
other segment activities are insignificant.
2. New Accounting Standards
During 2013, we adopted, on a retrospective basis, new guidance relating to balance sheet offsetting disclosures. The new guidance requires
enhanced disclosures regarding an entity’s ability to offset certain instruments on the balance sheet and how offsetting impacts the balance sheet. The adoption
of this guidance resulted in expanded disclosures relating to our derivative instruments (see Note 17), but did not impact our financial statement results.
During 2013, we also adopted, on a prospective basis, new guidance relating to reporting amounts reclassified from accumulated other
comprehensive income. This guidance requires new disclosures relating to accumulated other comprehensive income and how reclassifications from
accumulated other comprehensive income impact net income. As a result of adopting this new guidance, we have included a new footnote disclosure to provide
the information required by the new standard (see Notes 21 and S-4). The adoption of this guidance did not impact our financial statement results.
In July 2013, new guidance was issued which will generally require entities to present unrecognized tax benefits as a reduction to any available
deferred tax asset for a net operating loss, a similar tax loss, or a tax credit carryforward. The intent of this guidance is to eliminate diversity in practice in the
presentation of certain unrecognized tax benefits. The new guidance is effective for us during the first quarter of 2014, and is permitted to be adopted using
either a prospective or retrospective application. Currently, we do not present unrecognized tax benefits as a reduction to deferred tax asset carryforwards on
the balance sheet. As a result, the adoption of this new guidance
93