APS 2013 Annual Report Download - page 175
Download and view the complete annual report
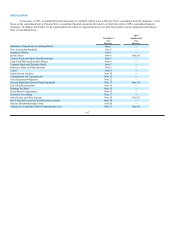
Please find page 175 of the 2013 APS annual report below. You can navigate through the pages in the report by either clicking on the pages listed below, or by using the keyword search tool below to find specific information within the annual report.-
 1
1 -
2
-
3
-
4
-
5
-
6
-
7
-
8
-
9
-
10
-
11
-
12
-
13
-
14
-
15
-
16
-
17
-
18
-
19
-
20
-
21
-
22
-
23
-
24
-
25
-
26
-
27
-
28
-
29
-
30
-
31
-
32
-
33
-
34
-
35
-
36
-
37
-
38
-
39
-
40
-
41
-
42
-
43
-
44
-
45
-
46
-
47
-
48
-
49
-
50
-
51
-
52
-
53
-
54
-
55
-
56
-
57
-
58
-
59
-
60
-
61
-
62
-
63
-
64
-
65
-
66
-
67
-
68
-
69
-
70
-
71
-
72
-
73
-
74
-
75
-
76
-
77
-
78
-
79
-
80
-
81
-
82
-
83
-
84
-
85
-
86
-
87
-
88
-
89
-
90
-
91
-
92
-
93
-
94
-
95
-
96
-
97
-
98
-
99
-
100
-
101
-
102
-
103
-
104
-
105
-
106
-
107
-
108
-
109
-
110
-
111
-
112
-
113
-
114
-
115
-
116
-
117
-
118
-
119
-
120
-
121
-
122
-
123
-
124
-
125
-
126
-
127
-
128
-
129
-
130
-
131
-
132
-
133
-
134
-
135
-
136
-
137
-
138
-
139
-
140
-
141
-
142
-
143
-
144
-
145
-
146
-
147
-
148
-
149
-
150
-
151
-
152
-
153
-
154
-
155
-
156
-
157
-
158
-
159
-
160
-
161
-
162
-
163
-
164
-
 165
165 -
 166
166 -
 167
167 -
 168
168 -
 169
169 -
 170
170 -
 171
171 -
 172
172 -
 173
173 -
 174
174 -
 175
175 -
 176
176 -
 177
177 -
 178
178 -
 179
179 -
 180
180 -
 181
181 -
 182
182 -
 183
183 -
 184
184 -
 185
185 -
186
-
187
-
188
-
189
-
190
-
191
-
192
-
193
-
194
-
195
-
196
-
197
-
198
-
199
-
200
-
201
-
202
-
203
-
204
-
205
-
206
-
207
-
208
-
209
-
210
-
211
-
212
-
213
-
214
-
215
-
216
-
217
-
218
-
219
-
220
-
221
-
222
-
223
-
224
-
225
-
226
-
227
-
228
-
229
-
230
-
231
-
232
-
233
-
234
-
235
-
236
-
237
-
238
-
239
-
240
-
241
-
242
-
243
-
244
-
245
-
246
-
247
-
248
-
249
-
250
-
251
-
252
-
253
-
254
-
255
-
256
-
257
-
258
-
259
-
260
-
261
-
262
-
263
-
264
-
265
-
266
 |
 |
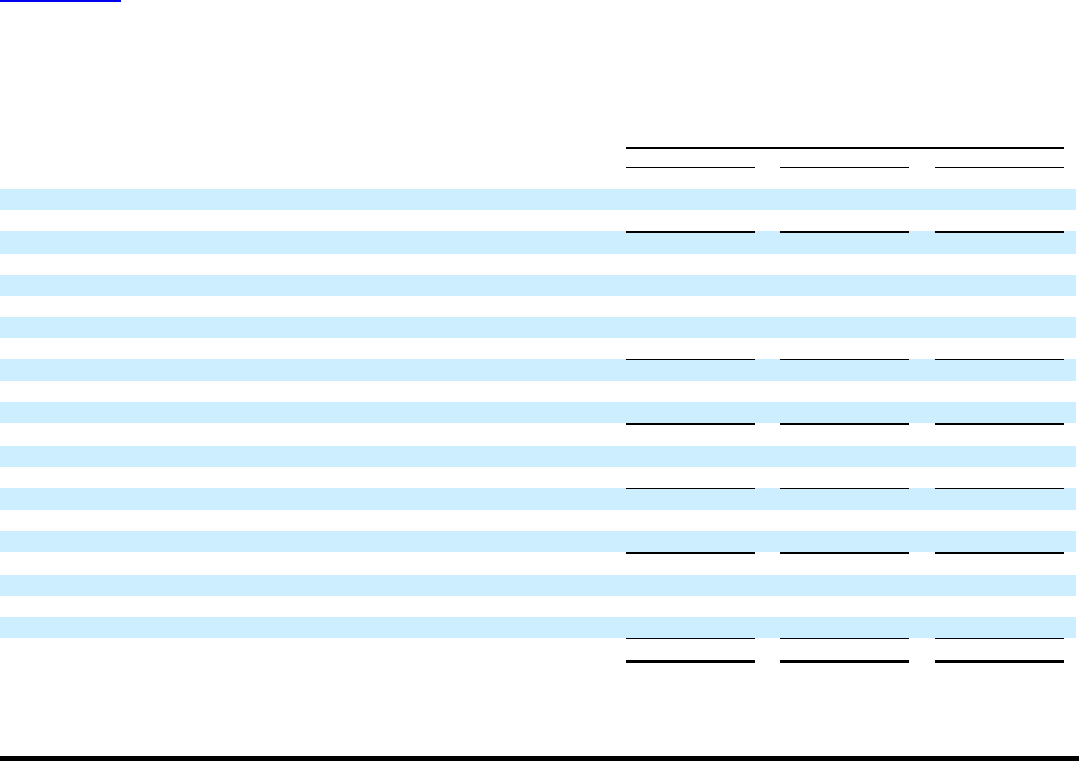
Table of Contents
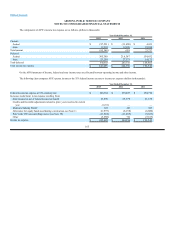
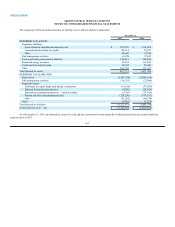
PINNACLE WEST CAPITAL CORPORATION HOLDING COMPANY
SCHEDULE I — CONDENSED FINANCIAL INFORMATION OF REGISTRANT
CONDENSED STATEMENTS OF COMPREHENSIVE INCOME
(in thousands)
Year Ended December 31,
2013 2012 2011
Operating revenues $799 $ 6,133 $ 1,034
Operating expenses 24,930 12,125 8,811
Operating loss (24,131)(5,992) (7,777)
Other
Equity in earnings of subsidiaries 420,926 391,528 335,859
Other expense (1,999)(2,001)(1,481)
Total 418,927 389,527 334,378
Interest expense 3,226 4,868 8,053
Income from continuing operations 391,570 378,667 318,548
Income tax benefit (14,504) (7,079) (8,938)
Income from continuing operations — net of income taxes 406,074 385,746 327,486
Income (loss) from discontinued operations — net of income taxes —(4,204)11,987
Net income attributable to common shareholders 406,074 381,542 339,473
Other comprehensive income — attributable to common shareholders 35,955 38,155 7,605
Total comprehensive income — attributable to common shareholders $442,029 $419,697 $347,078
See Notes to Pinnacle West’s Consolidated Financial Statements.
170