APS 2013 Annual Report Download - page 121
Download and view the complete annual report
Please find page 121 of the 2013 APS annual report below. You can navigate through the pages in the report by either clicking on the pages listed below, or by using the keyword search tool below to find specific information within the annual report.-
 1
1 -
2
-
3
-
4
-
5
-
6
-
7
-
8
-
9
-
10
-
11
-
12
-
13
-
14
-
15
-
16
-
17
-
18
-
19
-
20
-
21
-
22
-
23
-
24
-
25
-
26
-
27
-
28
-
29
-
30
-
31
-
32
-
33
-
34
-
35
-
36
-
37
-
38
-
39
-
40
-
41
-
42
-
43
-
44
-
45
-
46
-
47
-
48
-
49
-
50
-
51
-
52
-
53
-
54
-
55
-
56
-
57
-
58
-
59
-
60
-
61
-
62
-
63
-
64
-
65
-
66
-
67
-
68
-
69
-
70
-
71
-
72
-
73
-
74
-
75
-
76
-
77
-
78
-
79
-
80
-
81
-
82
-
83
-
84
-
85
-
86
-
87
-
88
-
89
-
90
-
91
-
92
-
93
-
94
-
95
-
96
-
97
-
98
-
99
-
100
-
101
-
102
-
103
-
104
-
105
-
106
-
107
-
108
-
109
-
110
-
 111
111 -
 112
112 -
 113
113 -
 114
114 -
 115
115 -
 116
116 -
 117
117 -
 118
118 -
 119
119 -
 120
120 -
 121
121 -
 122
122 -
 123
123 -
 124
124 -
 125
125 -
 126
126 -
 127
127 -
 128
128 -
 129
129 -
 130
130 -
 131
131 -
132
-
133
-
134
-
135
-
136
-
137
-
138
-
139
-
140
-
141
-
142
-
143
-
144
-
145
-
146
-
147
-
148
-
149
-
150
-
151
-
152
-
153
-
154
-
155
-
156
-
157
-
158
-
159
-
160
-
161
-
162
-
163
-
164
-
165
-
166
-
167
-
168
-
169
-
170
-
171
-
172
-
173
-
174
-
175
-
176
-
177
-
178
-
179
-
180
-
181
-
182
-
183
-
184
-
185
-
186
-
187
-
188
-
189
-
190
-
191
-
192
-
193
-
194
-
195
-
196
-
197
-
198
-
199
-
200
-
201
-
202
-
203
-
204
-
205
-
206
-
207
-
208
-
209
-
210
-
211
-
212
-
213
-
214
-
215
-
216
-
217
-
218
-
219
-
220
-
221
-
222
-
223
-
224
-
225
-
226
-
227
-
228
-
229
-
230
-
231
-
232
-
233
-
234
-
235
-
236
-
237
-
238
-
239
-
240
-
241
-
242
-
243
-
244
-
245
-
246
-
247
-
248
-
249
-
250
-
251
-
252
-
253
-
254
-
255
-
256
-
257
-
258
-
259
-
260
-
261
-
262
-
263
-
264
-
265
-
266
 |
 |

Table of Contents
PINNACLE WEST CAPITAL CORPORATION
NOTES TO CONSOLIDATED FINANCIAL STATEMENTS
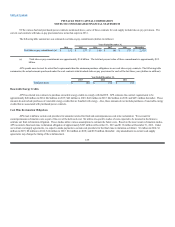
The investment strategies for these plans include external management of plan assets, and prohibition of investments in Pinnacle West securities.
The overall strategy of the pension plan’s IPS is to achieve an adequate level of trust assets relative to the benefit obligations. To achieve this
objective, the plan’s investment policy provides for mixes of investments including long-term fixed income assets and return-generating assets. The target
allocation between return-generating and long-term fixed income assets is defined in the IPS and is a function of the plan’s funded status. The plan’s funded
status is reviewed on at least a monthly basis.
Long-term fixed income assets, also known as liability-hedging assets, are designed to offset changes in the benefit obligations due to changes in
interest rates. Long-term fixed income assets consist primarily of fixed income debt securities issued by the U.S. Treasury, other government agencies, and
corporations. Long-term fixed income assets may also include interest rate swaps, U.S. Treasury futures and other instruments.
Return-generating assets are intended to provide a reasonable long-term rate of investment return with a prudent level of volatility. Return-generating
assets are composed of U.S. equities, international equities, and alternative investments. International equities include investments in both developed and
emerging markets. Alternative investments include investments in real estate, private equity and various other strategies. The plan may hold investments in
return-generating assets by holding securities in common and collective trusts.
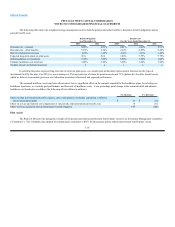
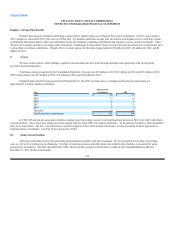
Based on the IPS, and given the pension plan’s funded status at year-end 2013, the long-term fixed income assets had a target allocation of 58% with
a permissible range of 55% to 61% and the return-generating assets had a target allocation of 42% with a permissible range of 45% to 39%. The return-
generating assets have additional target allocations, as a percent of total plan assets, of 22% equities in U.S. and other developed markets, 6% equities in
emerging markets, and 14% in alternative investments. The pension plan IPS does not provide for a specific mix of long-term fixed income assets, but does
expect the average credit quality of such assets to be investment grade. As of December 31, 2013, long-term fixed income assets represented 55% of total
pension plan assets, and return-generating assets represented 45% of total pension plan assets.
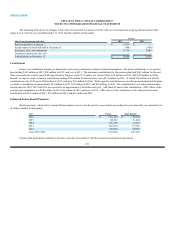
The asset allocation for other postretirement benefit plan assets is governed by the IPS for those plans, which provides for an asset allocation target
mix of generally 25% of fixed income assets and 75% of non-fixed income assets. This asset allocation target mix does not vary with the plan’s funded
status. As of December 31, 2013, investment in fixed income assets represented 38% of the other postretirement benefit plan total assets, and non-fixed income
assets represented 62% of the other postretirement benefit plan’s assets. Fixed income assets are primarily invested in corporate bonds of investment-grade
U.S. issuers, and U.S. Treasuries. Non-fixed income assets are primarily invested in large cap U.S. equities in diverse industries, and international equities
in both emerging and developed markets.
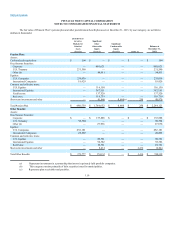
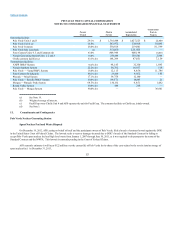
See Note 14 for a discussion on the fair value hierarchy and how fair value methodologies are applied. The plans invest directly in fixed income and
equity securities, in addition to investing indirectly in fixed income securities, equity securities and real estate through the use of common and collective
trusts. Equity securities held directly by the plans are valued using quoted active market prices from the published exchange on which the equity security
trades, and are classified as Level 1. Fixed income securities issued by the U.S. Treasury held directly by the plans are valued using quoted
117