APS 2013 Annual Report Download - page 172
Download and view the complete annual report
Please find page 172 of the 2013 APS annual report below. You can navigate through the pages in the report by either clicking on the pages listed below, or by using the keyword search tool below to find specific information within the annual report.-
 1
1 -
2
-
3
-
4
-
5
-
6
-
7
-
8
-
9
-
10
-
11
-
12
-
13
-
14
-
15
-
16
-
17
-
18
-
19
-
20
-
21
-
22
-
23
-
24
-
25
-
26
-
27
-
28
-
29
-
30
-
31
-
32
-
33
-
34
-
35
-
36
-
37
-
38
-
39
-
40
-
41
-
42
-
43
-
44
-
45
-
46
-
47
-
48
-
49
-
50
-
51
-
52
-
53
-
54
-
55
-
56
-
57
-
58
-
59
-
60
-
61
-
62
-
63
-
64
-
65
-
66
-
67
-
68
-
69
-
70
-
71
-
72
-
73
-
74
-
75
-
76
-
77
-
78
-
79
-
80
-
81
-
82
-
83
-
84
-
85
-
86
-
87
-
88
-
89
-
90
-
91
-
92
-
93
-
94
-
95
-
96
-
97
-
98
-
99
-
100
-
101
-
102
-
103
-
104
-
105
-
106
-
107
-
108
-
109
-
110
-
111
-
112
-
113
-
114
-
115
-
116
-
117
-
118
-
119
-
120
-
121
-
122
-
123
-
124
-
125
-
126
-
127
-
128
-
129
-
130
-
131
-
132
-
133
-
134
-
135
-
136
-
137
-
138
-
139
-
140
-
141
-
142
-
143
-
144
-
145
-
146
-
147
-
148
-
149
-
150
-
151
-
152
-
153
-
154
-
155
-
156
-
157
-
158
-
159
-
160
-
161
-
 162
162 -
 163
163 -
 164
164 -
 165
165 -
 166
166 -
 167
167 -
 168
168 -
 169
169 -
 170
170 -
 171
171 -
 172
172 -
 173
173 -
 174
174 -
 175
175 -
 176
176 -
 177
177 -
 178
178 -
 179
179 -
 180
180 -
 181
181 -
 182
182 -
183
-
184
-
185
-
186
-
187
-
188
-
189
-
190
-
191
-
192
-
193
-
194
-
195
-
196
-
197
-
198
-
199
-
200
-
201
-
202
-
203
-
204
-
205
-
206
-
207
-
208
-
209
-
210
-
211
-
212
-
213
-
214
-
215
-
216
-
217
-
218
-
219
-
220
-
221
-
222
-
223
-
224
-
225
-
226
-
227
-
228
-
229
-
230
-
231
-
232
-
233
-
234
-
235
-
236
-
237
-
238
-
239
-
240
-
241
-
242
-
243
-
244
-
245
-
246
-
247
-
248
-
249
-
250
-
251
-
252
-
253
-
254
-
255
-
256
-
257
-
258
-
259
-
260
-
261
-
262
-
263
-
264
-
265
-
266
 |
 |
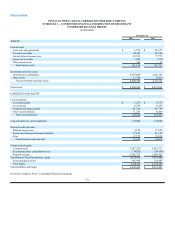
Table of Contents
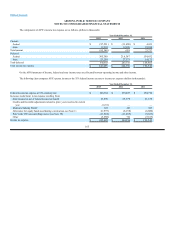
ARIZONA PUBLIC SERVICE COMPANY
NOTES TO CONSOLIDATED FINANCIAL STATEMENTS
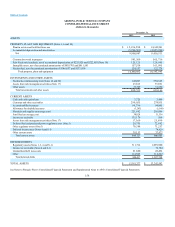
The components of the net deferred income tax liability were as follows (dollars in thousands):
December 31,
2013 2012
DEFERRED TAX ASSETS
Regulatory liabilities:
Asset retirement obligation and removal costs $235,959 $238,669
Unamortized investment tax credits 82,116 53,837
Other 42,609 33,764
Risk management activities 44,920 72,243
Pension and other postretirement liabilities 186,213 392,486
Renewable energy incentives 65,434 66,941
Credit and loss carryforwards 38,183 52,441
Other 166,781 111,327
Total deferred tax assets 862,215 1,021,708
DEFERRED TAX LIABILITIES
Plant-related (2,903,730)(2,584,166)
Risk management activities (16,191)(23,940)
Regulatory assets:
Allowance for equity funds used during construction (43,058)(37,899)
Deferred fuel and purchased power (8,282) (28,858)
Deferred fuel and purchased power — mark-to-market (13,343)(15,796)
Pension and other postretirement benefits (129,250)(316,757)
Other (93,202) (68,170)
Other (4,916)(5,678)
Total deferred tax liabilities (3,211,972)(3,081,264)
Deferred income taxes — net $(2,349,757)$(2,059,556)
As of December 31, 2013, the deferred tax assets for credit and loss carryforwards relate primarily to federal general business credits which first
begin to expire in 2031.
167