APS 2013 Annual Report Download - page 160
Download and view the complete annual report
Please find page 160 of the 2013 APS annual report below. You can navigate through the pages in the report by either clicking on the pages listed below, or by using the keyword search tool below to find specific information within the annual report.-
 1
1 -
2
-
3
-
4
-
5
-
6
-
7
-
8
-
9
-
10
-
11
-
12
-
13
-
14
-
15
-
16
-
17
-
18
-
19
-
20
-
21
-
22
-
23
-
24
-
25
-
26
-
27
-
28
-
29
-
30
-
31
-
32
-
33
-
34
-
35
-
36
-
37
-
38
-
39
-
40
-
41
-
42
-
43
-
44
-
45
-
46
-
47
-
48
-
49
-
50
-
51
-
52
-
53
-
54
-
55
-
56
-
57
-
58
-
59
-
60
-
61
-
62
-
63
-
64
-
65
-
66
-
67
-
68
-
69
-
70
-
71
-
72
-
73
-
74
-
75
-
76
-
77
-
78
-
79
-
80
-
81
-
82
-
83
-
84
-
85
-
86
-
87
-
88
-
89
-
90
-
91
-
92
-
93
-
94
-
95
-
96
-
97
-
98
-
99
-
100
-
101
-
102
-
103
-
104
-
105
-
106
-
107
-
108
-
109
-
110
-
111
-
112
-
113
-
114
-
115
-
116
-
117
-
118
-
119
-
120
-
121
-
122
-
123
-
124
-
125
-
126
-
127
-
128
-
129
-
130
-
131
-
132
-
133
-
134
-
135
-
136
-
137
-
138
-
139
-
140
-
141
-
142
-
143
-
144
-
145
-
146
-
147
-
148
-
149
-
 150
150 -
 151
151 -
 152
152 -
 153
153 -
 154
154 -
 155
155 -
 156
156 -
 157
157 -
 158
158 -
 159
159 -
 160
160 -
 161
161 -
 162
162 -
 163
163 -
 164
164 -
 165
165 -
 166
166 -
 167
167 -
 168
168 -
 169
169 -
 170
170 -
171
-
172
-
173
-
174
-
175
-
176
-
177
-
178
-
179
-
180
-
181
-
182
-
183
-
184
-
185
-
186
-
187
-
188
-
189
-
190
-
191
-
192
-
193
-
194
-
195
-
196
-
197
-
198
-
199
-
200
-
201
-
202
-
203
-
204
-
205
-
206
-
207
-
208
-
209
-
210
-
211
-
212
-
213
-
214
-
215
-
216
-
217
-
218
-
219
-
220
-
221
-
222
-
223
-
224
-
225
-
226
-
227
-
228
-
229
-
230
-
231
-
232
-
233
-
234
-
235
-
236
-
237
-
238
-
239
-
240
-
241
-
242
-
243
-
244
-
245
-
246
-
247
-
248
-
249
-
250
-
251
-
252
-
253
-
254
-
255
-
256
-
257
-
258
-
259
-
260
-
261
-
262
-
263
-
264
-
265
-
266
 |
 |

Table of Contents
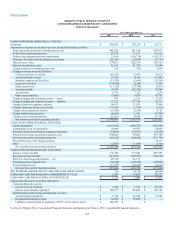
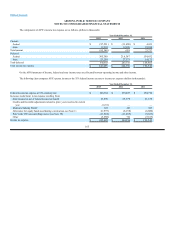
ARIZONA PUBLIC SERVICE COMPANY
CONSOLIDATED STATEMENTS OF INCOME
(dollars in thousands)
Year Ended December 31,
2013 2012 2011
ELECTRIC OPERATING REVENUES $3,451,251 $3,293,489 $3,237,241
OPERATING EXPENSES
Fuel and purchased power 1,095,709 994,790 1,009,464
Operations and maintenance 897,824 873,916 895,917
Depreciation and amortization 415,612 404,242 426,958
Income taxes (Notes 4 and S-1) 256,864 256,600 204,066
Taxes other than income taxes 163,377 158,412 146,453
Total 2,829,386 2,687,960 2,682,858
OPERATING INCOME 621,865 605,529 554,383
OTHER INCOME (DEDUCTIONS)
Income taxes (Notes 4 and S-1) 11,769 12,204 11,524
Allowance for equity funds used during construction (Note 1) 25,581 22,436 23,707
Other income (Note S-3) 3,896 2,868 5,071
Other expense (Note S-3) (20,449) (21,150) (15,328)
Total 20,797 16,358 24,974
INTEREST EXPENSE
Interest on long-term debt 188,011 198,398 218,981
Interest on short-term borrowings 6,605 7,135 10,345
Debt discount, premium and expense 4,046 4,215 4,616
Allowance for borrowed funds used during construction (Note 1) (14,861) (14,971) (18,358)
Total 183,801 194,777 215,584
NET INCOME 458,861 427,110 363,773
Less: Net income attributable to noncontrolling interests (Note 19) 33,892 31,613 27,524
NET INCOME ATTRIBUTABLE TO COMMON SHAREHOLDER $424,969 $395,497 $ 336,249
See Notes to Pinnacle West’s Consolidated Financial Statements and Supplemental Notes to Arizona Public Service Company’s Consolidated Financial
Statements.
156