APS 2013 Annual Report Download - page 61
Download and view the complete annual report
Please find page 61 of the 2013 APS annual report below. You can navigate through the pages in the report by either clicking on the pages listed below, or by using the keyword search tool below to find specific information within the annual report.-
 1
1 -
2
-
3
-
4
-
5
-
6
-
7
-
8
-
9
-
10
-
11
-
12
-
13
-
14
-
15
-
16
-
17
-
18
-
19
-
20
-
21
-
22
-
23
-
24
-
25
-
26
-
27
-
28
-
29
-
30
-
31
-
32
-
33
-
34
-
35
-
36
-
37
-
38
-
39
-
40
-
41
-
42
-
43
-
44
-
45
-
46
-
47
-
48
-
49
-
50
-
 51
51 -
 52
52 -
 53
53 -
 54
54 -
 55
55 -
 56
56 -
 57
57 -
 58
58 -
 59
59 -
 60
60 -
 61
61 -
 62
62 -
 63
63 -
 64
64 -
 65
65 -
 66
66 -
 67
67 -
 68
68 -
 69
69 -
 70
70 -
 71
71 -
72
-
73
-
74
-
75
-
76
-
77
-
78
-
79
-
80
-
81
-
82
-
83
-
84
-
85
-
86
-
87
-
88
-
89
-
90
-
91
-
92
-
93
-
94
-
95
-
96
-
97
-
98
-
99
-
100
-
101
-
102
-
103
-
104
-
105
-
106
-
107
-
108
-
109
-
110
-
111
-
112
-
113
-
114
-
115
-
116
-
117
-
118
-
119
-
120
-
121
-
122
-
123
-
124
-
125
-
126
-
127
-
128
-
129
-
130
-
131
-
132
-
133
-
134
-
135
-
136
-
137
-
138
-
139
-
140
-
141
-
142
-
143
-
144
-
145
-
146
-
147
-
148
-
149
-
150
-
151
-
152
-
153
-
154
-
155
-
156
-
157
-
158
-
159
-
160
-
161
-
162
-
163
-
164
-
165
-
166
-
167
-
168
-
169
-
170
-
171
-
172
-
173
-
174
-
175
-
176
-
177
-
178
-
179
-
180
-
181
-
182
-
183
-
184
-
185
-
186
-
187
-
188
-
189
-
190
-
191
-
192
-
193
-
194
-
195
-
196
-
197
-
198
-
199
-
200
-
201
-
202
-
203
-
204
-
205
-
206
-
207
-
208
-
209
-
210
-
211
-
212
-
213
-
214
-
215
-
216
-
217
-
218
-
219
-
220
-
221
-
222
-
223
-
224
-
225
-
226
-
227
-
228
-
229
-
230
-
231
-
232
-
233
-
234
-
235
-
236
-
237
-
238
-
239
-
240
-
241
-
242
-
243
-
244
-
245
-
246
-
247
-
248
-
249
-
250
-
251
-
252
-
253
-
254
-
255
-
256
-
257
-
258
-
259
-
260
-
261
-
262
-
263
-
264
-
265
-
266
 |
 |

Table of Contents
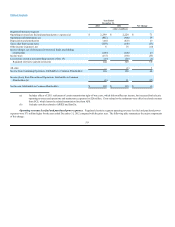
increased plant in service, partially offset by the regulatory deferral of operating expenses associated with the closure of Four Corners Units 1, 2, and 3.
Interest charges, net of allowance for borrowed funds used during construction . Interest charges, net of allowance for borrowed funds used
during construction, decreased $13 million for the year ended December 31, 2013 compared with the prior year, primarily because of lower debt balances and
lower interest rates in the current year.
Income taxes. Income taxes were $5 million lower for the year ended December 31, 2013 compared with the prior year primarily due to a lower
effective tax rate in the current period, partially offset by the effects of higher pretax income in the current year.
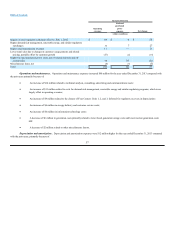
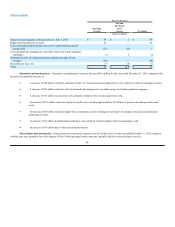
Operating Results – 2012 compared with 2011.
Our consolidated net income attributable to common shareholders for the year ended December 31, 2012 was $382 million, compared with net
income of $339 million for the prior year. The results reflect an increase of approximately $59 million for the regulated electricity segment, primarily due to
increases related to the retail regulatory settlement effective July 1, 2012 (see Note 3); higher retail transmission revenues, lower depreciation and amortization
due to 20-year Palo Verde license extensions received in 2011; and lower net interest charges due to lower debt balances and lower interest rates in the current
year.
The $17 million decrease in discontinued operations is primarily related to a contribution Pinnacle West made to SunCor’s estate as part of a
negotiated resolution to the bankruptcy (see Note 1) and absence of the 2011 gain on sale of our investment in APSES.
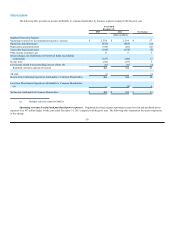
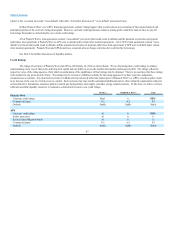
The following table presents net income attributable to common shareholders by business segment compared with the prior year:
58