APS 2013 Annual Report Download - page 176
Download and view the complete annual report
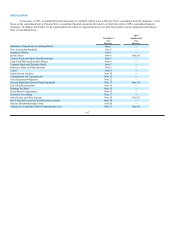
Please find page 176 of the 2013 APS annual report below. You can navigate through the pages in the report by either clicking on the pages listed below, or by using the keyword search tool below to find specific information within the annual report.-
 1
1 -
2
-
3
-
4
-
5
-
6
-
7
-
8
-
9
-
10
-
11
-
12
-
13
-
14
-
15
-
16
-
17
-
18
-
19
-
20
-
21
-
22
-
23
-
24
-
25
-
26
-
27
-
28
-
29
-
30
-
31
-
32
-
33
-
34
-
35
-
36
-
37
-
38
-
39
-
40
-
41
-
42
-
43
-
44
-
45
-
46
-
47
-
48
-
49
-
50
-
51
-
52
-
53
-
54
-
55
-
56
-
57
-
58
-
59
-
60
-
61
-
62
-
63
-
64
-
65
-
66
-
67
-
68
-
69
-
70
-
71
-
72
-
73
-
74
-
75
-
76
-
77
-
78
-
79
-
80
-
81
-
82
-
83
-
84
-
85
-
86
-
87
-
88
-
89
-
90
-
91
-
92
-
93
-
94
-
95
-
96
-
97
-
98
-
99
-
100
-
101
-
102
-
103
-
104
-
105
-
106
-
107
-
108
-
109
-
110
-
111
-
112
-
113
-
114
-
115
-
116
-
117
-
118
-
119
-
120
-
121
-
122
-
123
-
124
-
125
-
126
-
127
-
128
-
129
-
130
-
131
-
132
-
133
-
134
-
135
-
136
-
137
-
138
-
139
-
140
-
141
-
142
-
143
-
144
-
145
-
146
-
147
-
148
-
149
-
150
-
151
-
152
-
153
-
154
-
155
-
156
-
157
-
158
-
159
-
160
-
161
-
162
-
163
-
164
-
165
-
 166
166 -
 167
167 -
 168
168 -
 169
169 -
 170
170 -
 171
171 -
 172
172 -
 173
173 -
 174
174 -
 175
175 -
 176
176 -
 177
177 -
 178
178 -
 179
179 -
 180
180 -
 181
181 -
 182
182 -
 183
183 -
 184
184 -
 185
185 -
 186
186 -
187
-
188
-
189
-
190
-
191
-
192
-
193
-
194
-
195
-
196
-
197
-
198
-
199
-
200
-
201
-
202
-
203
-
204
-
205
-
206
-
207
-
208
-
209
-
210
-
211
-
212
-
213
-
214
-
215
-
216
-
217
-
218
-
219
-
220
-
221
-
222
-
223
-
224
-
225
-
226
-
227
-
228
-
229
-
230
-
231
-
232
-
233
-
234
-
235
-
236
-
237
-
238
-
239
-
240
-
241
-
242
-
243
-
244
-
245
-
246
-
247
-
248
-
249
-
250
-
251
-
252
-
253
-
254
-
255
-
256
-
257
-
258
-
259
-
260
-
261
-
262
-
263
-
264
-
265
-
266
 |
 |

Table of Contents
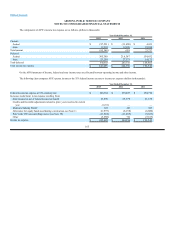
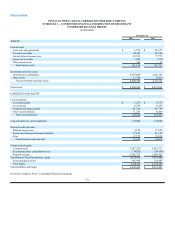
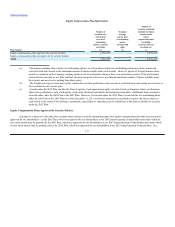
PINNACLE WEST CAPITAL CORPORATION HOLDING COMPANY
SCHEDULE I — CONDENSED FINANCIAL INFORMATION OF REGISTRANT
CONDENSED BALANCE SHEETS
(in thousands)
December 31,
2013 2012
ASSETS
Current assets
Cash and cash equivalents $5,798 $22,679
Accounts receivable 80,108 92,906
Current deferred income taxes 93,185 77,771
Income tax receivable 1,853 3,350
Other current assets 242 25
Total current assets 181,186 196,731
Investments and other assets
Investments in subsidiaries 4,455,049 4,223,301
Other assets 13,789 13,833
Total investments and other assets 4,468,838 4,237,134
Total Assets $ 4,650,024 $ 4,433,865
LIABILITIES AND EQUITY
Current liabilities
Accounts payable $3,279 $5,735
Accrued taxes 8,538 8,239
Common dividends payable 62,528 59,789
Other current liabilities 31,295 41,000
Total current liabilities 105,640 114,763
Long-term debt less current maturities 125,000 125,000
Deferred credits and other
Deferred income taxes 4,158 17,395
Pension and other postretirement liabilities 37,611 41,199
Other 37,155 33,219
Total deferred credits and other 78,924 91,813
Common stock equity
Common stock 2,487,250 2,462,712
Accumulated other comprehensive loss (78,053)(114,008)
Retained earnings 1,785,273 1,624,102
Total Pinnacle West Shareholders’ equity 4,194,470 3,972,806
Noncontrolling interests 145,990 129,483
Total Equity 4,340,460 4,102,289
Total Liabilities and Equity $ 4,650,024 $ 4,433,865
See Notes to Pinnacle West’s Consolidated Financial Statements.
171