APS 2013 Annual Report Download - page 148
Download and view the complete annual report
Please find page 148 of the 2013 APS annual report below. You can navigate through the pages in the report by either clicking on the pages listed below, or by using the keyword search tool below to find specific information within the annual report.-
 1
1 -
2
-
3
-
4
-
5
-
6
-
7
-
8
-
9
-
10
-
11
-
12
-
13
-
14
-
15
-
16
-
17
-
18
-
19
-
20
-
21
-
22
-
23
-
24
-
25
-
26
-
27
-
28
-
29
-
30
-
31
-
32
-
33
-
34
-
35
-
36
-
37
-
38
-
39
-
40
-
41
-
42
-
43
-
44
-
45
-
46
-
47
-
48
-
49
-
50
-
51
-
52
-
53
-
54
-
55
-
56
-
57
-
58
-
59
-
60
-
61
-
62
-
63
-
64
-
65
-
66
-
67
-
68
-
69
-
70
-
71
-
72
-
73
-
74
-
75
-
76
-
77
-
78
-
79
-
80
-
81
-
82
-
83
-
84
-
85
-
86
-
87
-
88
-
89
-
90
-
91
-
92
-
93
-
94
-
95
-
96
-
97
-
98
-
99
-
100
-
101
-
102
-
103
-
104
-
105
-
106
-
107
-
108
-
109
-
110
-
111
-
112
-
113
-
114
-
115
-
116
-
117
-
118
-
119
-
120
-
121
-
122
-
123
-
124
-
125
-
126
-
127
-
128
-
129
-
130
-
131
-
132
-
133
-
134
-
135
-
136
-
137
-
 138
138 -
 139
139 -
 140
140 -
 141
141 -
 142
142 -
 143
143 -
 144
144 -
 145
145 -
 146
146 -
 147
147 -
 148
148 -
 149
149 -
 150
150 -
 151
151 -
 152
152 -
 153
153 -
 154
154 -
 155
155 -
 156
156 -
 157
157 -
 158
158 -
159
-
160
-
161
-
162
-
163
-
164
-
165
-
166
-
167
-
168
-
169
-
170
-
171
-
172
-
173
-
174
-
175
-
176
-
177
-
178
-
179
-
180
-
181
-
182
-
183
-
184
-
185
-
186
-
187
-
188
-
189
-
190
-
191
-
192
-
193
-
194
-
195
-
196
-
197
-
198
-
199
-
200
-
201
-
202
-
203
-
204
-
205
-
206
-
207
-
208
-
209
-
210
-
211
-
212
-
213
-
214
-
215
-
216
-
217
-
218
-
219
-
220
-
221
-
222
-
223
-
224
-
225
-
226
-
227
-
228
-
229
-
230
-
231
-
232
-
233
-
234
-
235
-
236
-
237
-
238
-
239
-
240
-
241
-
242
-
243
-
244
-
245
-
246
-
247
-
248
-
249
-
250
-
251
-
252
-
253
-
254
-
255
-
256
-
257
-
258
-
259
-
260
-
261
-
262
-
263
-
264
-
265
-
266
 |
 |

Table of Contents
PINNACLE WEST CAPITAL CORPORATION
NOTES TO CONSOLIDATED FINANCIAL STATEMENTS
delivery periods) and for which power does not flow are netted, which reduces both revenues and fuel and purchased power costs in our Consolidated
Statements of Income, but does not impact our financial condition, net income or cash flows.
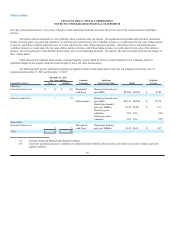
On June 1, 2012, we elected to discontinue cash flow hedge accounting treatment for the significant majority of our contracts that had previously
been designated as cash flow hedges. This discontinuation is due to changes in PSA recovery (see Note 3), which now allows for 100% deferral of the
unrealized gains and losses relating to these contracts. For those contracts that were de-designated, all changes in fair value after May 31, 2012 are no longer
recorded through OCI, but are deferred through the PSA. The amounts previously recorded in accumulated OCI relating to these instruments will remain in
accumulated OCI, and will transfer to earnings in the same period or periods during which the hedged transaction affects earnings or sooner if we determine it
is probable that the forecasted transaction will not occur. When amounts have been reclassified from accumulated OCI to earnings, they will be subject to
deferral in accordance with the PSA. Cash flow hedge accounting treatment will continue for a limited number of contracts that are not subject to PSA
recovery.
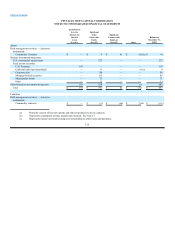
Our derivative instruments, excluding those qualifying for a scope exception, are recorded on the balance sheet as an asset or liability and are
measured at fair value. See Note 14 for a discussion of fair value measurements. Derivative instruments may qualify for the normal purchases and normal
sales scope exception if they require physical delivery and the quantities represent those transacted in the normal course of business. Derivative instruments
qualifying for the normal purchases and sales scope exception are accounted for under the accrual method of accounting and excluded from our derivative
instrument discussion and disclosures below.
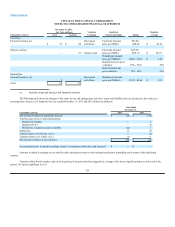
Hedge effectiveness is the degree to which the derivative instrument contract and the hedged item are correlated and is measured based on the relative
changes in fair value of the derivative instrument contract and the hedged item over time. We assess hedge effectiveness both at inception and on a continuing
basis. These assessments exclude the time value of certain options. For accounting hedges that are deemed an effective hedge, the effective portion of the gain
or loss on the derivative instrument is reported as a component of OCI and reclassified into earnings in the same period during which the hedged transaction
affects earnings. We recognize in current earnings, subject to the PSA, the gains and losses representing hedge ineffectiveness, and the gains and losses on
any hedge components which are excluded from our effectiveness assessment. As cash flow hedge accounting has been discontinued for the significant
majority of our contracts, after May 31, 2012, effectiveness testing is no longer being performed for these contracts.
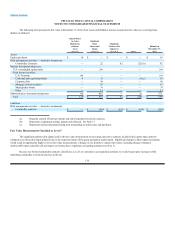
Prior to the 2012 Settlement Agreement, for its regulated operations, APS deferred for future rate treatment approximately 90% of unrealized gains and
losses on certain derivatives pursuant to the PSA mechanism that would otherwise be recognized in income. Due to the 2012 Settlement Agreement, for its
regulated operations, APS now defers for future rate treatment 100% of the unrealized gains and losses for delivery periods after June 30, 2012 on derivatives
pursuant to the PSA mechanism that would otherwise be recognized in income. Realized gains and losses on derivatives are deferred in accordance with the
PSA to the extent the amounts are above or below the Base Fuel Rate (see Note 3). Gains and losses from derivatives in the following tables represent the
amounts reflected in income before the effect of PSA deferrals.
144