APS 2013 Annual Report Download - page 106
Download and view the complete annual report
Please find page 106 of the 2013 APS annual report below. You can navigate through the pages in the report by either clicking on the pages listed below, or by using the keyword search tool below to find specific information within the annual report.-
 1
1 -
2
-
3
-
4
-
5
-
6
-
7
-
8
-
9
-
10
-
11
-
12
-
13
-
14
-
15
-
16
-
17
-
18
-
19
-
20
-
21
-
22
-
23
-
24
-
25
-
26
-
27
-
28
-
29
-
30
-
31
-
32
-
33
-
34
-
35
-
36
-
37
-
38
-
39
-
40
-
41
-
42
-
43
-
44
-
45
-
46
-
47
-
48
-
49
-
50
-
51
-
52
-
53
-
54
-
55
-
56
-
57
-
58
-
59
-
60
-
61
-
62
-
63
-
64
-
65
-
66
-
67
-
68
-
69
-
70
-
71
-
72
-
73
-
74
-
75
-
76
-
77
-
78
-
79
-
80
-
81
-
82
-
83
-
84
-
85
-
86
-
87
-
88
-
89
-
90
-
91
-
92
-
93
-
94
-
95
-
 96
96 -
 97
97 -
 98
98 -
 99
99 -
 100
100 -
 101
101 -
 102
102 -
 103
103 -
 104
104 -
 105
105 -
 106
106 -
 107
107 -
 108
108 -
 109
109 -
 110
110 -
 111
111 -
 112
112 -
 113
113 -
 114
114 -
 115
115 -
 116
116 -
117
-
118
-
119
-
120
-
121
-
122
-
123
-
124
-
125
-
126
-
127
-
128
-
129
-
130
-
131
-
132
-
133
-
134
-
135
-
136
-
137
-
138
-
139
-
140
-
141
-
142
-
143
-
144
-
145
-
146
-
147
-
148
-
149
-
150
-
151
-
152
-
153
-
154
-
155
-
156
-
157
-
158
-
159
-
160
-
161
-
162
-
163
-
164
-
165
-
166
-
167
-
168
-
169
-
170
-
171
-
172
-
173
-
174
-
175
-
176
-
177
-
178
-
179
-
180
-
181
-
182
-
183
-
184
-
185
-
186
-
187
-
188
-
189
-
190
-
191
-
192
-
193
-
194
-
195
-
196
-
197
-
198
-
199
-
200
-
201
-
202
-
203
-
204
-
205
-
206
-
207
-
208
-
209
-
210
-
211
-
212
-
213
-
214
-
215
-
216
-
217
-
218
-
219
-
220
-
221
-
222
-
223
-
224
-
225
-
226
-
227
-
228
-
229
-
230
-
231
-
232
-
233
-
234
-
235
-
236
-
237
-
238
-
239
-
240
-
241
-
242
-
243
-
244
-
245
-
246
-
247
-
248
-
249
-
250
-
251
-
252
-
253
-
254
-
255
-
256
-
257
-
258
-
259
-
260
-
261
-
262
-
263
-
264
-
265
-
266
 |
 |

Table of Contents
PINNACLE WEST CAPITAL CORPORATION
NOTES TO CONSOLIDATED FINANCIAL STATEMENTS
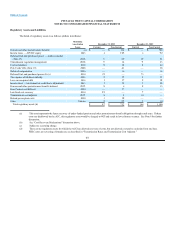
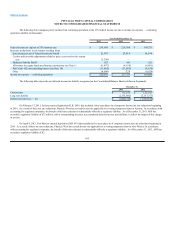
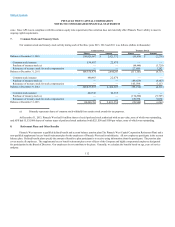
The detail of regulatory liabilities is as follows (dollars in millions):
Remaining
Amortization December 31, 2013 December 31, 2012
Period Current Non-Current Current Non-Current
Removal costs (a) $ 28 $ 303 $ 27 $ 321
Asset retirement obligations (a) — 266 —256
Renewable energy standard (b) 2015 33 15 43 —
Income taxes — change in rates 2043 —74 —66
Spent nuclear fuel 2047 6 36 10 36
Deferred gains on utility property 2019 2 10 2 12
Income taxes — deferred investment tax credit 2043 379 252
Demand side management (b) 2014 27 — 4—
Other Various — 18 — 16
Total regulatory liabilities $99 $801 $ 88 $ 759
(a) In accordance with regulatory accounting guidance, APS accrues for removal costs for its regulated assets, even if there is no legal
obligation for removal (see Note 12).
(b) See “Cost Recovery Mechanisms” discussion above.
4. Income Taxes
Certain assets and liabilities are reported differently for income tax purposes than they are for financial statement purposes. The tax effect of these
differences is recorded as deferred taxes. We calculate deferred taxes using currently enacted income tax rates.
APS has recorded regulatory assets and regulatory liabilities related to income taxes on its Balance Sheets in accordance with accounting guidance for
regulated operations. The regulatory assets are for certain temporary differences, primarily the allowance for equity funds used during construction and
pension and other postretirement benefits. The regulatory liabilities primarily relate to deferred taxes resulting from investment tax credits (“ITC”) and the
change in income tax rates.
In accordance with regulatory requirements, APS ITCs are deferred and are amortized over the life of the related property with such amortization
applied as a credit to reduce current income tax expense in the statement of income.
The $70 million long-term income tax receivable on the Consolidated Balance Sheets as of December 31, 2012 represented the anticipated refund
related to an APS tax accounting method change approved by the IRS in the third quarter of 2009. On July 9, 2013, IRS guidance was released which
provided clarification regarding the timing and amount of this cash receipt. As a result of this guidance, uncertain tax positions decreased $67 million during
the third quarter. This decrease in uncertain tax positions resulted in a corresponding increase to the total anticipated refund due from the IRS and an offsetting
increase in long-term deferred tax liabilities. Additionally, as a result of this IRS guidance, the resulting $137 million anticipated refund was reclassified to
current income tax receivable.
102