APS 2013 Annual Report Download - page 170
Download and view the complete annual report
Please find page 170 of the 2013 APS annual report below. You can navigate through the pages in the report by either clicking on the pages listed below, or by using the keyword search tool below to find specific information within the annual report.-
 1
1 -
2
-
3
-
4
-
5
-
6
-
7
-
8
-
9
-
10
-
11
-
12
-
13
-
14
-
15
-
16
-
17
-
18
-
19
-
20
-
21
-
22
-
23
-
24
-
25
-
26
-
27
-
28
-
29
-
30
-
31
-
32
-
33
-
34
-
35
-
36
-
37
-
38
-
39
-
40
-
41
-
42
-
43
-
44
-
45
-
46
-
47
-
48
-
49
-
50
-
51
-
52
-
53
-
54
-
55
-
56
-
57
-
58
-
59
-
60
-
61
-
62
-
63
-
64
-
65
-
66
-
67
-
68
-
69
-
70
-
71
-
72
-
73
-
74
-
75
-
76
-
77
-
78
-
79
-
80
-
81
-
82
-
83
-
84
-
85
-
86
-
87
-
88
-
89
-
90
-
91
-
92
-
93
-
94
-
95
-
96
-
97
-
98
-
99
-
100
-
101
-
102
-
103
-
104
-
105
-
106
-
107
-
108
-
109
-
110
-
111
-
112
-
113
-
114
-
115
-
116
-
117
-
118
-
119
-
120
-
121
-
122
-
123
-
124
-
125
-
126
-
127
-
128
-
129
-
130
-
131
-
132
-
133
-
134
-
135
-
136
-
137
-
138
-
139
-
140
-
141
-
142
-
143
-
144
-
145
-
146
-
147
-
148
-
149
-
150
-
151
-
152
-
153
-
154
-
155
-
156
-
157
-
158
-
159
-
 160
160 -
 161
161 -
 162
162 -
 163
163 -
 164
164 -
 165
165 -
 166
166 -
 167
167 -
 168
168 -
 169
169 -
 170
170 -
 171
171 -
 172
172 -
 173
173 -
 174
174 -
 175
175 -
 176
176 -
 177
177 -
 178
178 -
 179
179 -
 180
180 -
181
-
182
-
183
-
184
-
185
-
186
-
187
-
188
-
189
-
190
-
191
-
192
-
193
-
194
-
195
-
196
-
197
-
198
-
199
-
200
-
201
-
202
-
203
-
204
-
205
-
206
-
207
-
208
-
209
-
210
-
211
-
212
-
213
-
214
-
215
-
216
-
217
-
218
-
219
-
220
-
221
-
222
-
223
-
224
-
225
-
226
-
227
-
228
-
229
-
230
-
231
-
232
-
233
-
234
-
235
-
236
-
237
-
238
-
239
-
240
-
241
-
242
-
243
-
244
-
245
-
246
-
247
-
248
-
249
-
250
-
251
-
252
-
253
-
254
-
255
-
256
-
257
-
258
-
259
-
260
-
261
-
262
-
263
-
264
-
265
-
266
 |
 |
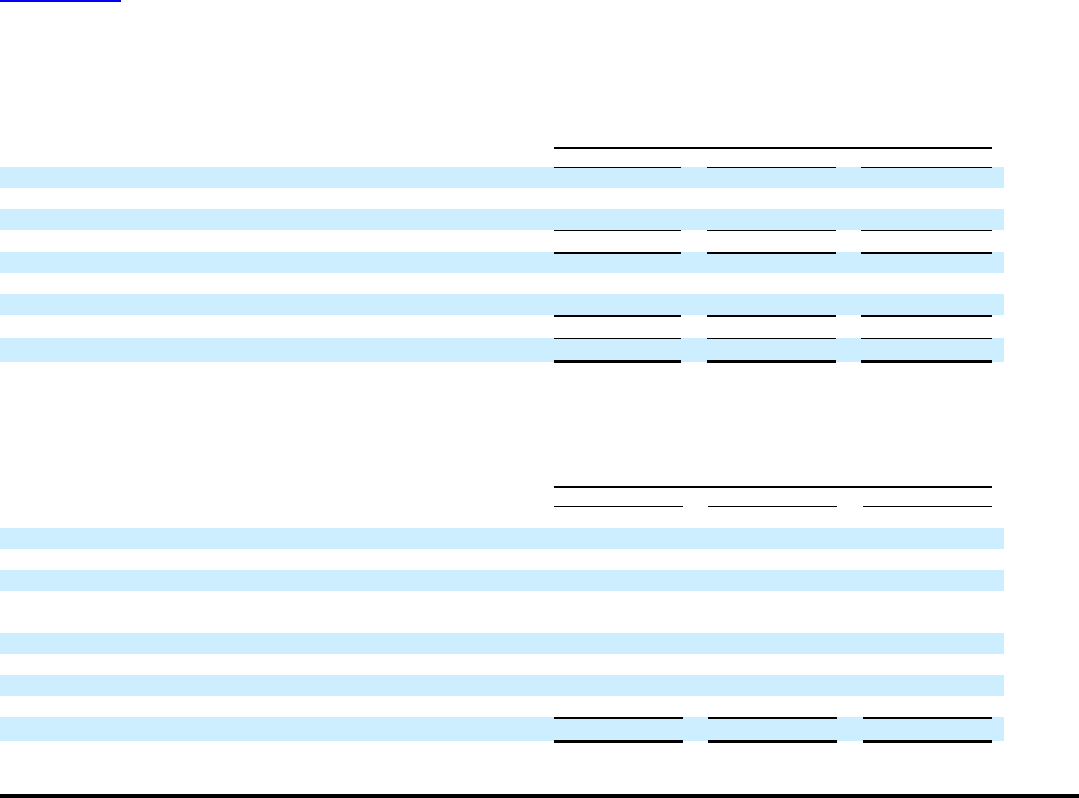
Table of Contents
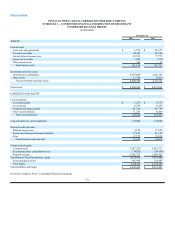
ARIZONA PUBLIC SERVICE COMPANY
NOTES TO CONSOLIDATED FINANCIAL STATEMENTS
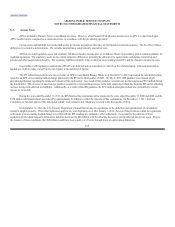
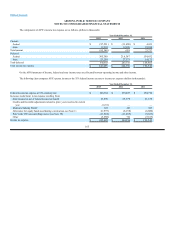
The components of APS’s income tax expense are as follows (dollars in thousands):
Year Ended December 31,
2013 2012 2011
Current:
Federal $(97,531) $ (11,650) $ 4,633
State 11,983 12,308 19,104
Total current (85,548)658 23,737
Deferred:
Federal 305,389 216,367 154,632
State 25,254 27,371 14,173
Total deferred 330,643 243,738 168,805
Total income tax expense $245,095 $ 244,396 $ 192,542
On the APS Statements of Income, federal and state income taxes are allocated between operating income and other income.
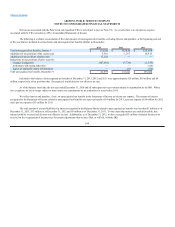
The following chart compares APS’s pretax income at the 35% federal income tax rate to income tax expense (dollars in thousands):
Year Ended December 31,
2013 2012 2011
Federal income tax expense at 35% statutory rate $246,384 $ 235,027 $ 194,710
Increases (reductions) in tax expense resulting from:
State income tax net of federal income tax benefit 23,970 25,379 21,139
Credits and favorable adjustments related to prior years resolved in current
year (3,231) — —
Medicare Subsidy Part-D 823 483 823
Allowance for equity funds used during construction (see Note 1) (6,997)(6,158) (6,880)
Palo Verde VIE noncontrolling interest (see Note 19) (11,862)(11,065) (9,633)
Other (3,992)730 (7,617)
Income tax expense $245,095 $ 244,396 $ 192,542
165