APS 2013 Annual Report Download - page 83
Download and view the complete annual report
Please find page 83 of the 2013 APS annual report below. You can navigate through the pages in the report by either clicking on the pages listed below, or by using the keyword search tool below to find specific information within the annual report.-
 1
1 -
2
-
3
-
4
-
5
-
6
-
7
-
8
-
9
-
10
-
11
-
12
-
13
-
14
-
15
-
16
-
17
-
18
-
19
-
20
-
21
-
22
-
23
-
24
-
25
-
26
-
27
-
28
-
29
-
30
-
31
-
32
-
33
-
34
-
35
-
36
-
37
-
38
-
39
-
40
-
41
-
42
-
43
-
44
-
45
-
46
-
47
-
48
-
49
-
50
-
51
-
52
-
53
-
54
-
55
-
56
-
57
-
58
-
59
-
60
-
61
-
62
-
63
-
64
-
65
-
66
-
67
-
68
-
69
-
70
-
71
-
72
-
 73
73 -
 74
74 -
 75
75 -
 76
76 -
 77
77 -
 78
78 -
 79
79 -
 80
80 -
 81
81 -
 82
82 -
 83
83 -
 84
84 -
 85
85 -
 86
86 -
 87
87 -
 88
88 -
 89
89 -
 90
90 -
 91
91 -
 92
92 -
 93
93 -
94
-
95
-
96
-
97
-
98
-
99
-
100
-
101
-
102
-
103
-
104
-
105
-
106
-
107
-
108
-
109
-
110
-
111
-
112
-
113
-
114
-
115
-
116
-
117
-
118
-
119
-
120
-
121
-
122
-
123
-
124
-
125
-
126
-
127
-
128
-
129
-
130
-
131
-
132
-
133
-
134
-
135
-
136
-
137
-
138
-
139
-
140
-
141
-
142
-
143
-
144
-
145
-
146
-
147
-
148
-
149
-
150
-
151
-
152
-
153
-
154
-
155
-
156
-
157
-
158
-
159
-
160
-
161
-
162
-
163
-
164
-
165
-
166
-
167
-
168
-
169
-
170
-
171
-
172
-
173
-
174
-
175
-
176
-
177
-
178
-
179
-
180
-
181
-
182
-
183
-
184
-
185
-
186
-
187
-
188
-
189
-
190
-
191
-
192
-
193
-
194
-
195
-
196
-
197
-
198
-
199
-
200
-
201
-
202
-
203
-
204
-
205
-
206
-
207
-
208
-
209
-
210
-
211
-
212
-
213
-
214
-
215
-
216
-
217
-
218
-
219
-
220
-
221
-
222
-
223
-
224
-
225
-
226
-
227
-
228
-
229
-
230
-
231
-
232
-
233
-
234
-
235
-
236
-
237
-
238
-
239
-
240
-
241
-
242
-
243
-
244
-
245
-
246
-
247
-
248
-
249
-
250
-
251
-
252
-
253
-
254
-
255
-
256
-
257
-
258
-
259
-
260
-
261
-
262
-
263
-
264
-
265
-
266
 |
 |

Table of Contents
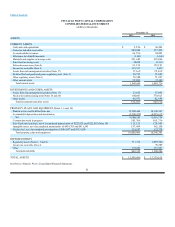
PINNACLE WEST CAPITAL CORPORATION
CONSOLIDATED STATEMENTS OF INCOME
(dollars and shares in thousands, except per share amounts)
Year Ended December 31,
2013 2012 2011
OPERATING REVENUES $3,454,628 $3,301,804 $ 3,241,379
OPERATING EXPENSES
Fuel and purchased power 1,095,709 994,790 1,009,464
Operations and maintenance 924,727 884,769 904,286
Depreciation and amortization 415,708 404,336 427,054
Taxes other than income taxes 164,167 159,323 147,408
Other expenses 7,994 6,831 6,659
Total 2,608,305 2,450,049 2,494,871
OPERATING INCOME 846,323 851,755 746,508
OTHER INCOME (DEDUCTIONS)
Allowance for equity funds used during construction (Note 1) 25,581 22,436 23,707
Other income (Note 18) 1,704 1,606 3,111
Other expense (Note 18) (16,024) (19,842) (10,451)
Total 11,261 4,200 16,367
INTEREST EXPENSE
Interest charges 201,888 214,616 241,995
Allowance for borrowed funds used during construction (Note 1) (14,861) (14,971) (18,358)
Total 187,027 199,645 223,637
INCOME FROM CONTINUING OPERATIONS BEFORE INCOME TAXES 670,557 656,310 539,238
INCOME TAXES (Note 4) 230,591 237,317 183,604
INCOME FROM CONTINUING OPERATIONS 439,966 418,993 355,634
INCOME (LOSS) FROM DISCONTINUED OPERATIONS
Net of income tax expense (benefit) of $—, $(3,813) and $7,418 (Note 1) —(5,829)11,306
NET INCOME 439,966 413,164 366,940
Less: Net income attributable to noncontrolling interests (Note 19) 33,892 31,622 27,467
NET INCOME ATTRIBUTABLE TO COMMON SHAREHOLDERS $406,074 $ 381,542 $ 339,473
WEIGHTED-AVERAGE COMMON SHARES OUTSTANDING — BASIC 109,984 109,510 109,053
WEIGHTED-AVERAGE COMMON SHARES OUTSTANDING — DILUTED 110,806 110,527 109,864
EARNINGS PER WEIGHTED — AVERAGE COMMON SHARE OUTSTANDING
Income from continuing operations attributable to common shareholders — basic $3.69 $3.54 $3.01
Net income attributable to common shareholders — basic 3.69 3.48 3.11
Income from continuing operations attributable to common shareholders — diluted 3.66 3.50 2.99
Net income attributable to common shareholders — diluted 3.66 3.45 3.09
AMOUNTS ATTRIBUTABLE TO COMMON SHAREHOLDERS:
Income from continuing operations, net of tax $406,074 $387,380 $328,110
Discontinued operations, net of tax — (5,838) 11,363
Net income attributable to common shareholders $406,074 $ 381,542 $ 339,473
See Notes to Pinnacle West’s Consolidated Financial Statements.
80