APS 2013 Annual Report Download - page 84
Download and view the complete annual report
Please find page 84 of the 2013 APS annual report below. You can navigate through the pages in the report by either clicking on the pages listed below, or by using the keyword search tool below to find specific information within the annual report.-
 1
1 -
2
-
3
-
4
-
5
-
6
-
7
-
8
-
9
-
10
-
11
-
12
-
13
-
14
-
15
-
16
-
17
-
18
-
19
-
20
-
21
-
22
-
23
-
24
-
25
-
26
-
27
-
28
-
29
-
30
-
31
-
32
-
33
-
34
-
35
-
36
-
37
-
38
-
39
-
40
-
41
-
42
-
43
-
44
-
45
-
46
-
47
-
48
-
49
-
50
-
51
-
52
-
53
-
54
-
55
-
56
-
57
-
58
-
59
-
60
-
61
-
62
-
63
-
64
-
65
-
66
-
67
-
68
-
69
-
70
-
71
-
72
-
73
-
 74
74 -
 75
75 -
 76
76 -
 77
77 -
 78
78 -
 79
79 -
 80
80 -
 81
81 -
 82
82 -
 83
83 -
 84
84 -
 85
85 -
 86
86 -
 87
87 -
 88
88 -
 89
89 -
 90
90 -
 91
91 -
 92
92 -
 93
93 -
 94
94 -
95
-
96
-
97
-
98
-
99
-
100
-
101
-
102
-
103
-
104
-
105
-
106
-
107
-
108
-
109
-
110
-
111
-
112
-
113
-
114
-
115
-
116
-
117
-
118
-
119
-
120
-
121
-
122
-
123
-
124
-
125
-
126
-
127
-
128
-
129
-
130
-
131
-
132
-
133
-
134
-
135
-
136
-
137
-
138
-
139
-
140
-
141
-
142
-
143
-
144
-
145
-
146
-
147
-
148
-
149
-
150
-
151
-
152
-
153
-
154
-
155
-
156
-
157
-
158
-
159
-
160
-
161
-
162
-
163
-
164
-
165
-
166
-
167
-
168
-
169
-
170
-
171
-
172
-
173
-
174
-
175
-
176
-
177
-
178
-
179
-
180
-
181
-
182
-
183
-
184
-
185
-
186
-
187
-
188
-
189
-
190
-
191
-
192
-
193
-
194
-
195
-
196
-
197
-
198
-
199
-
200
-
201
-
202
-
203
-
204
-
205
-
206
-
207
-
208
-
209
-
210
-
211
-
212
-
213
-
214
-
215
-
216
-
217
-
218
-
219
-
220
-
221
-
222
-
223
-
224
-
225
-
226
-
227
-
228
-
229
-
230
-
231
-
232
-
233
-
234
-
235
-
236
-
237
-
238
-
239
-
240
-
241
-
242
-
243
-
244
-
245
-
246
-
247
-
248
-
249
-
250
-
251
-
252
-
253
-
254
-
255
-
256
-
257
-
258
-
259
-
260
-
261
-
262
-
263
-
264
-
265
-
266
 |
 |

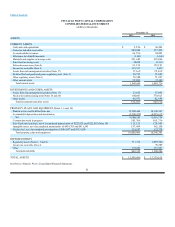
Table of Contents
PINNACLE WEST CAPITAL CORPORATION
CONSOLIDATED STATEMENTS OF COMPREHENSIVE INCOME
(dollars in thousands)
Year Ended December 31,
2013 2012 2011
NET INCOME $439,966 $413,164 $366,940
OTHER COMPREHENSIVE INCOME (LOSS), NET OF TAX
Derivative instruments:
Net unrealized loss, net of tax benefit of $140, $14,900, and $37,389 (Note 17) (213) (22,763) (57,271)
Reclassification of net realized loss, net of tax benefit of $17,472, $39,120, and
$46,288 (Note 17) 26,747 59,887 70,902
Pension and other postretirement benefits activity, net of tax (expense) benefit of
$(6,156), $(651), and $3,935 (Note 8) 9,421 1,031 (6,026)
Total other comprehensive income 35,955 38,155 7,605
COMPREHENSIVE INCOME 475,921 451,319 374,545
Less: Comprehensive income attributable to noncontrolling interests 33,892 31,622 27,467
COMPREHENSIVE INCOME ATTRIBUTABLE TO COMMON SHAREHOLDERS $442,029 $419,697 $347,078
See Notes to Pinnacle West’s Consolidated Financial Statements.
81