APS 2013 Annual Report Download - page 142
Download and view the complete annual report
Please find page 142 of the 2013 APS annual report below. You can navigate through the pages in the report by either clicking on the pages listed below, or by using the keyword search tool below to find specific information within the annual report.-
 1
1 -
2
-
3
-
4
-
5
-
6
-
7
-
8
-
9
-
10
-
11
-
12
-
13
-
14
-
15
-
16
-
17
-
18
-
19
-
20
-
21
-
22
-
23
-
24
-
25
-
26
-
27
-
28
-
29
-
30
-
31
-
32
-
33
-
34
-
35
-
36
-
37
-
38
-
39
-
40
-
41
-
42
-
43
-
44
-
45
-
46
-
47
-
48
-
49
-
50
-
51
-
52
-
53
-
54
-
55
-
56
-
57
-
58
-
59
-
60
-
61
-
62
-
63
-
64
-
65
-
66
-
67
-
68
-
69
-
70
-
71
-
72
-
73
-
74
-
75
-
76
-
77
-
78
-
79
-
80
-
81
-
82
-
83
-
84
-
85
-
86
-
87
-
88
-
89
-
90
-
91
-
92
-
93
-
94
-
95
-
96
-
97
-
98
-
99
-
100
-
101
-
102
-
103
-
104
-
105
-
106
-
107
-
108
-
109
-
110
-
111
-
112
-
113
-
114
-
115
-
116
-
117
-
118
-
119
-
120
-
121
-
122
-
123
-
124
-
125
-
126
-
127
-
128
-
129
-
130
-
131
-
 132
132 -
 133
133 -
 134
134 -
 135
135 -
 136
136 -
 137
137 -
 138
138 -
 139
139 -
 140
140 -
 141
141 -
 142
142 -
 143
143 -
 144
144 -
 145
145 -
 146
146 -
 147
147 -
 148
148 -
 149
149 -
 150
150 -
 151
151 -
 152
152 -
153
-
154
-
155
-
156
-
157
-
158
-
159
-
160
-
161
-
162
-
163
-
164
-
165
-
166
-
167
-
168
-
169
-
170
-
171
-
172
-
173
-
174
-
175
-
176
-
177
-
178
-
179
-
180
-
181
-
182
-
183
-
184
-
185
-
186
-
187
-
188
-
189
-
190
-
191
-
192
-
193
-
194
-
195
-
196
-
197
-
198
-
199
-
200
-
201
-
202
-
203
-
204
-
205
-
206
-
207
-
208
-
209
-
210
-
211
-
212
-
213
-
214
-
215
-
216
-
217
-
218
-
219
-
220
-
221
-
222
-
223
-
224
-
225
-
226
-
227
-
228
-
229
-
230
-
231
-
232
-
233
-
234
-
235
-
236
-
237
-
238
-
239
-
240
-
241
-
242
-
243
-
244
-
245
-
246
-
247
-
248
-
249
-
250
-
251
-
252
-
253
-
254
-
255
-
256
-
257
-
258
-
259
-
260
-
261
-
262
-
263
-
264
-
265
-
266
 |
 |
Table of Contents
PINNACLE WEST CAPITAL CORPORATION
NOTES TO CONSOLIDATED FINANCIAL STATEMENTS
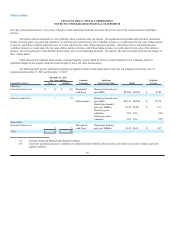
December 31, 2012
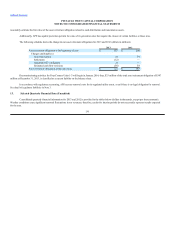
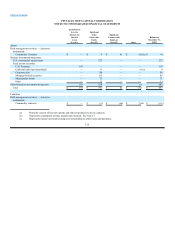
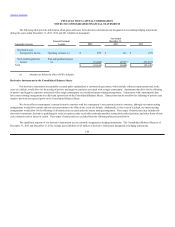
Fair Value (millions) Valuation Significant Weighted-
Commodity Contracts Assets Liabilities Technique Unobservable Input Range Average
Electricity:
Forward Contracts (a)
$57 $ 82
Discounted
cash flows
Electricity forward
price (per MWh)
$23.06 -
$64.20 $ 43.16
Option Contracts
— 27 Option model
Electricity forward
price (per MWh)
$36.66 -
$92.19 $60.97
Natural gas forward
price (per MMbtu) $4.10 - $4.25 $4.20
Implied electricity price
volatilities 15% - 66% 39%
Implied natural gas
price volatilities 17% - 36% 23%
Natural Gas:
Forward Contracts (a)
5 1
Discounted
cash flows
Natural gas forward
price (per MMbtu) $3.25 - $4.44 $3.93
Total $62 $110
(a) Includes swaps and physical and financial contracts.
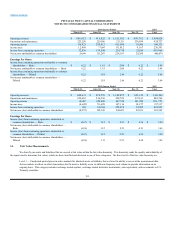
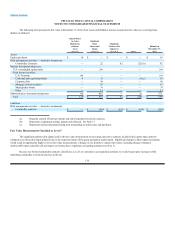
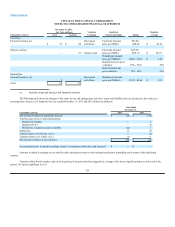
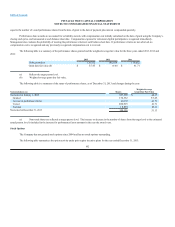
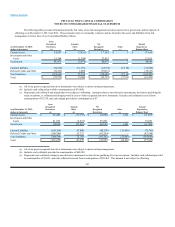
The following table shows the changes in fair value for our risk management activities’ assets and liabilities that are measured at fair value on a
recurring basis using Level 3 inputs for the years ended December 31, 2013 and 2012 (dollars in millions):
Year Ended
December 31,
Commodity Contracts 2013 2012
Net derivative balance at beginning of period $(48) $ (51)
Total net gains (losses) realized/unrealized:
Included in earnings — 2
Included in OCI —(3)
Deferred as a regulatory asset or liability (10) 7
Settlements 10 (5)
Transfers into Level 3 from Level 2 —(2)
Transfers from Level 3 into Level 2 (1)4
Net derivative balance at end of period $(49) $ (48)
Net unrealized gains included in earnings related to instruments still held at end of period $ — $ —
Amounts included in earnings are recorded in either operating revenues or fuel and purchased power depending on the nature of the underlying
contract.
Transfers reflect the fair market value at the beginning of the period and are triggered by a change in the lowest significant input as of the end of the
period. We had no significant Level 1
138