APS 2013 Annual Report Download - page 87
Download and view the complete annual report
Please find page 87 of the 2013 APS annual report below. You can navigate through the pages in the report by either clicking on the pages listed below, or by using the keyword search tool below to find specific information within the annual report.-
 1
1 -
2
-
3
-
4
-
5
-
6
-
7
-
8
-
9
-
10
-
11
-
12
-
13
-
14
-
15
-
16
-
17
-
18
-
19
-
20
-
21
-
22
-
23
-
24
-
25
-
26
-
27
-
28
-
29
-
30
-
31
-
32
-
33
-
34
-
35
-
36
-
37
-
38
-
39
-
40
-
41
-
42
-
43
-
44
-
45
-
46
-
47
-
48
-
49
-
50
-
51
-
52
-
53
-
54
-
55
-
56
-
57
-
58
-
59
-
60
-
61
-
62
-
63
-
64
-
65
-
66
-
67
-
68
-
69
-
70
-
71
-
72
-
73
-
74
-
75
-
76
-
 77
77 -
 78
78 -
 79
79 -
 80
80 -
 81
81 -
 82
82 -
 83
83 -
 84
84 -
 85
85 -
 86
86 -
 87
87 -
 88
88 -
 89
89 -
 90
90 -
 91
91 -
 92
92 -
 93
93 -
 94
94 -
 95
95 -
 96
96 -
 97
97 -
98
-
99
-
100
-
101
-
102
-
103
-
104
-
105
-
106
-
107
-
108
-
109
-
110
-
111
-
112
-
113
-
114
-
115
-
116
-
117
-
118
-
119
-
120
-
121
-
122
-
123
-
124
-
125
-
126
-
127
-
128
-
129
-
130
-
131
-
132
-
133
-
134
-
135
-
136
-
137
-
138
-
139
-
140
-
141
-
142
-
143
-
144
-
145
-
146
-
147
-
148
-
149
-
150
-
151
-
152
-
153
-
154
-
155
-
156
-
157
-
158
-
159
-
160
-
161
-
162
-
163
-
164
-
165
-
166
-
167
-
168
-
169
-
170
-
171
-
172
-
173
-
174
-
175
-
176
-
177
-
178
-
179
-
180
-
181
-
182
-
183
-
184
-
185
-
186
-
187
-
188
-
189
-
190
-
191
-
192
-
193
-
194
-
195
-
196
-
197
-
198
-
199
-
200
-
201
-
202
-
203
-
204
-
205
-
206
-
207
-
208
-
209
-
210
-
211
-
212
-
213
-
214
-
215
-
216
-
217
-
218
-
219
-
220
-
221
-
222
-
223
-
224
-
225
-
226
-
227
-
228
-
229
-
230
-
231
-
232
-
233
-
234
-
235
-
236
-
237
-
238
-
239
-
240
-
241
-
242
-
243
-
244
-
245
-
246
-
247
-
248
-
249
-
250
-
251
-
252
-
253
-
254
-
255
-
256
-
257
-
258
-
259
-
260
-
261
-
262
-
263
-
264
-
265
-
266
 |
 |

Table of Contents
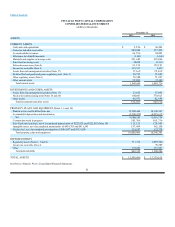
PINNACLE WEST CAPITAL CORPORATION
CONSOLIDATED STATEMENTS OF CASH FLOWS
(dollars in thousands)
Year Ended December 31,
2013 2012 2011
CASH FLOWS FROM OPERATING ACTIVITIES
Net Income $439,966 $413,164 $366,940
Adjustments to reconcile net income to net cash provided by operating activities:
Gain on sale of energy-related products and services business — — (10,404)
Depreciation and amortization including nuclear fuel 492,322 481,262 493,784
Deferred fuel and purchased power 21,678 71,573 69,166
Deferred fuel and purchased power amortization 31,190 (116,716)(155,157)
Allowance for equity funds used during construction (25,581)(22,436)(23,707)
Deferred income taxes 249,296 187,023 117,952
Deferred investment tax credit 52,542 41,579 58,240
Change in derivative instruments fair value 534 (749)4,064
Changes in current assets and liabilities:
Customer and other receivables (44,991) 14,587 40,626
Accrued unbilled revenues (1,951)30,394 (21,947)
Materials, supplies and fossil fuel (11,878)(23,043)(23,398)
Income tax receivable (133,094)(4,043) 3,983
Other current assets (17,913) (27,352) (3,079)
Accounts payable 45,414 (96,600)58,346
Accrued taxes 6,059 12,736 8,085
Other current liabilities (7,513) 23,869 20,358
Change in margin and collateral accounts — assets 993 2,216 33,349
Change in margin and collateral accounts — liabilities 12,355 137,785 29,731
Change in long-term income tax receivable 137,270 (1,756)(3,530)
Change in unrecognized tax benefits (91,425) (2,583) 8,410
Change in other regulatory liabilities 64,473 13,539 37,009
Change in other long-term assets (41,757) 6,872 (41,722)
Change in other long-term liabilities (24,682) 29,801 58,484
Net cash flow provided by operating activities 1,153,307 1,171,122 1,125,583
CASH FLOWS FROM INVESTING ACTIVITIES
Capital expenditures (1,016,322) (889,551)(884,350)
Contributions in aid of construction 41,090 49,876 38,096
Allowance for borrowed funds used during construction (14,861) (14,971) (18,358)
Proceeds from sale of energy-related products and services business — — 45,111
Proceeds from nuclear decommissioning trust sales 446,025 417,603 497,780
Investment in nuclear decommissioning trust (463,274)(434,852)(513,799)
Proceeds from sale of life insurance policies — — 55,444
Other (2,059)(1,099) (1,931)
Net cash flow used for investing activities (1,009,401)(872,994)(782,007)
CASH FLOWS FROM FINANCING ACTIVITIES
Issuance of long-term debt 136,307 476,081 470,353
Repayment of long-term debt (122,828) (654,286)(655,169)
Short-term borrowings and payments — net 60,950 92,175 (16,600)
Dividends paid on common stock (235,244)(225,075) (221,728)
Common stock equity issuance 17,319 15,955 15,841
Distributions to noncontrolling interests (17,385) (10,529)(10,210)
Other 299 170 (2,668)
Net cash flow used for financing activities (160,582) (305,509) (420,181)
NET DECREASE IN CASH AND CASH EQUIVALENTS (16,676)(7,381)(76,605)
CASH AND CASH EQUIVALENTS AT BEGINNING OF YEAR 26,202 33,583 110,188
CASH AND CASH EQUIVALENTS AT END OF YEAR $9,526 $26,202 $33,583
See Notes to Pinnacle West’s Consolidated Financial Statements.
84