APS 2013 Annual Report Download - page 143
Download and view the complete annual report
Please find page 143 of the 2013 APS annual report below. You can navigate through the pages in the report by either clicking on the pages listed below, or by using the keyword search tool below to find specific information within the annual report.-
 1
1 -
2
-
3
-
4
-
5
-
6
-
7
-
8
-
9
-
10
-
11
-
12
-
13
-
14
-
15
-
16
-
17
-
18
-
19
-
20
-
21
-
22
-
23
-
24
-
25
-
26
-
27
-
28
-
29
-
30
-
31
-
32
-
33
-
34
-
35
-
36
-
37
-
38
-
39
-
40
-
41
-
42
-
43
-
44
-
45
-
46
-
47
-
48
-
49
-
50
-
51
-
52
-
53
-
54
-
55
-
56
-
57
-
58
-
59
-
60
-
61
-
62
-
63
-
64
-
65
-
66
-
67
-
68
-
69
-
70
-
71
-
72
-
73
-
74
-
75
-
76
-
77
-
78
-
79
-
80
-
81
-
82
-
83
-
84
-
85
-
86
-
87
-
88
-
89
-
90
-
91
-
92
-
93
-
94
-
95
-
96
-
97
-
98
-
99
-
100
-
101
-
102
-
103
-
104
-
105
-
106
-
107
-
108
-
109
-
110
-
111
-
112
-
113
-
114
-
115
-
116
-
117
-
118
-
119
-
120
-
121
-
122
-
123
-
124
-
125
-
126
-
127
-
128
-
129
-
130
-
131
-
132
-
 133
133 -
 134
134 -
 135
135 -
 136
136 -
 137
137 -
 138
138 -
 139
139 -
 140
140 -
 141
141 -
 142
142 -
 143
143 -
 144
144 -
 145
145 -
 146
146 -
 147
147 -
 148
148 -
 149
149 -
 150
150 -
 151
151 -
 152
152 -
 153
153 -
154
-
155
-
156
-
157
-
158
-
159
-
160
-
161
-
162
-
163
-
164
-
165
-
166
-
167
-
168
-
169
-
170
-
171
-
172
-
173
-
174
-
175
-
176
-
177
-
178
-
179
-
180
-
181
-
182
-
183
-
184
-
185
-
186
-
187
-
188
-
189
-
190
-
191
-
192
-
193
-
194
-
195
-
196
-
197
-
198
-
199
-
200
-
201
-
202
-
203
-
204
-
205
-
206
-
207
-
208
-
209
-
210
-
211
-
212
-
213
-
214
-
215
-
216
-
217
-
218
-
219
-
220
-
221
-
222
-
223
-
224
-
225
-
226
-
227
-
228
-
229
-
230
-
231
-
232
-
233
-
234
-
235
-
236
-
237
-
238
-
239
-
240
-
241
-
242
-
243
-
244
-
245
-
246
-
247
-
248
-
249
-
250
-
251
-
252
-
253
-
254
-
255
-
256
-
257
-
258
-
259
-
260
-
261
-
262
-
263
-
264
-
265
-
266
 |
 |

Table of Contents
PINNACLE WEST CAPITAL CORPORATION
NOTES TO CONSOLIDATED FINANCIAL STATEMENTS
transfers to or from any other hierarchy level. Transfers in or out of Level 3 are typically related to our heat rate options and long-dated energy transactions
that extend beyond available quoted periods.
Financial Instruments Not Carried at Fair Value
The carrying value of our net accounts receivable, accounts payable and short-term borrowings approximate fair value. Our short-term borrowings
are classified within Level 2 of the fair value hierarchy. See Note 6 for our long-term debt fair values.
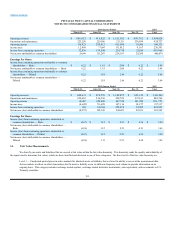
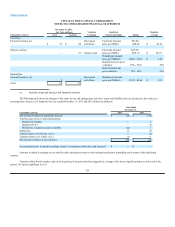
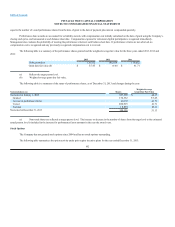
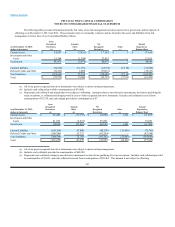
15. Earnings Per Share
The following table presents earnings attributable to common shareholders per weighted-average common share outstanding for the years ended
December 31, 2013, 2012 and 2011:
2013 2012 2011
Basic earnings per share:
Income from continuing operations attributable to common shareholders $3.69 $3.54 $3.01
Income (loss) from discontinued operations —(0.06)0.10
Earnings per share – basic $3.69 $3.48 $3.11
Diluted earnings per share:
Income from continuing operations attributable to common shareholders $3.66 $3.50 $2.99
Income (loss) from discontinued operations —(0.05)0.10
Earnings per share – diluted $3.66 $3.45 $3.09
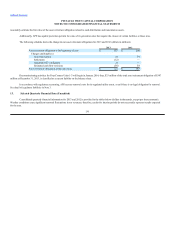
Dilutive stock options and performance shares (which are contingently issuable) increased average common shares outstanding by approximately
822,000 shares in 2013, 1,017,000 shares in 2012 and 811,000 shares in 2011. Total average common shares outstanding for the purposes of calculating
diluted earnings per share were 110,805,943 shares in 2013, 110,527,311 shares in 2012 and 109,864,243 shares in 2011.
For the years ended 2013, 2012 and 2011, there were no common stock options that were excluded from the computation of diluted earnings per
share as a result of the options’ exercise prices being greater than the average market price of the common shares.
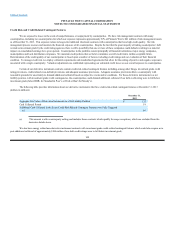
16. Stock-Based Compensation
Pinnacle West grants long-term incentive awards under the 2012 Long-Term Incentive Plan (“2012 Plan”) in the form of Stock Grants, Restricted
Stock Units and Performance Shares and may grant restricted stock, stock units, dividend equivalents, performance share units, performance cash,
incentive and non-qualified stock options, and stock appreciation rights. The 2012 Plan, effective May 16, 2012, provides 4,595,500 common shares to be
available for grant to eligible employees and members of the Board of Directors. Awards made since 2012 were issued under the 2012 Plan, and prior awards
from 2007 to 2011 were issued under the 2007 Long-Term Incentive Plan (“2007 Plan”).
139