APS 2013 Annual Report Download - page 67
Download and view the complete annual report
Please find page 67 of the 2013 APS annual report below. You can navigate through the pages in the report by either clicking on the pages listed below, or by using the keyword search tool below to find specific information within the annual report.-
 1
1 -
2
-
3
-
4
-
5
-
6
-
7
-
8
-
9
-
10
-
11
-
12
-
13
-
14
-
15
-
16
-
17
-
18
-
19
-
20
-
21
-
22
-
23
-
24
-
25
-
26
-
27
-
28
-
29
-
30
-
31
-
32
-
33
-
34
-
35
-
36
-
37
-
38
-
39
-
40
-
41
-
42
-
43
-
44
-
45
-
46
-
47
-
48
-
49
-
50
-
51
-
52
-
53
-
54
-
55
-
56
-
 57
57 -
 58
58 -
 59
59 -
 60
60 -
 61
61 -
 62
62 -
 63
63 -
 64
64 -
 65
65 -
 66
66 -
 67
67 -
 68
68 -
 69
69 -
 70
70 -
 71
71 -
 72
72 -
 73
73 -
 74
74 -
 75
75 -
 76
76 -
 77
77 -
78
-
79
-
80
-
81
-
82
-
83
-
84
-
85
-
86
-
87
-
88
-
89
-
90
-
91
-
92
-
93
-
94
-
95
-
96
-
97
-
98
-
99
-
100
-
101
-
102
-
103
-
104
-
105
-
106
-
107
-
108
-
109
-
110
-
111
-
112
-
113
-
114
-
115
-
116
-
117
-
118
-
119
-
120
-
121
-
122
-
123
-
124
-
125
-
126
-
127
-
128
-
129
-
130
-
131
-
132
-
133
-
134
-
135
-
136
-
137
-
138
-
139
-
140
-
141
-
142
-
143
-
144
-
145
-
146
-
147
-
148
-
149
-
150
-
151
-
152
-
153
-
154
-
155
-
156
-
157
-
158
-
159
-
160
-
161
-
162
-
163
-
164
-
165
-
166
-
167
-
168
-
169
-
170
-
171
-
172
-
173
-
174
-
175
-
176
-
177
-
178
-
179
-
180
-
181
-
182
-
183
-
184
-
185
-
186
-
187
-
188
-
189
-
190
-
191
-
192
-
193
-
194
-
195
-
196
-
197
-
198
-
199
-
200
-
201
-
202
-
203
-
204
-
205
-
206
-
207
-
208
-
209
-
210
-
211
-
212
-
213
-
214
-
215
-
216
-
217
-
218
-
219
-
220
-
221
-
222
-
223
-
224
-
225
-
226
-
227
-
228
-
229
-
230
-
231
-
232
-
233
-
234
-
235
-
236
-
237
-
238
-
239
-
240
-
241
-
242
-
243
-
244
-
245
-
246
-
247
-
248
-
249
-
250
-
251
-
252
-
253
-
254
-
255
-
256
-
257
-
258
-
259
-
260
-
261
-
262
-
263
-
264
-
265
-
266
 |
 |
Table of Contents
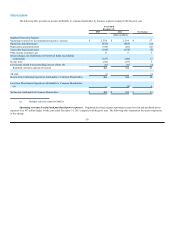
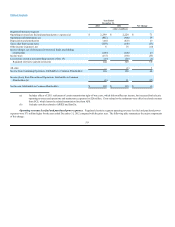
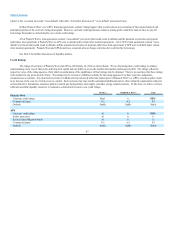
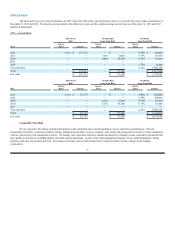
Capital Expenditures. The following table summarizes the estimated capital expenditures for the next three years:
Capital Expenditures
(dollars in millions)
Estimated for the Year Ended
December 31,
2014 2015 2016
APS
Generation:
Nuclear Fuel $80 $86 $ 88
Renewables 118 7 —
Environmental 30 57 213
Other Generation 230 248 355
Distribution 255 374 363
Transmission 198 213 196
Other (a) 54 41 48
Total APS $965 $1,026 $1,263
(a) Primarily information systems and facilities projects.
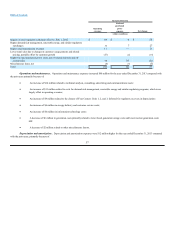
Generation capital expenditures are comprised of various improvements to APS’s existing fossil and nuclear plants. Examples of the types of projects
included in this category are additions, upgrades and capital replacements of various power plant equipment, such as turbines, boilers and environmental
equipment. The estimated Renewables expenditures include 20 MW of utility-scale solar projects which were approved by the ACC in the 2014 RES
Implementation Plan. We have not included estimated costs for Cholla’s compliance with MATS or EPA’s regional haze rule since we have challenged the
regional haze rule judicially and are considering our future options with respect to that plant if the regional haze rule is upheld. The portion of estimated costs
through 2016 for installation of pollution control equipment needed to ensure Four Corners’ compliance with EPA’s regional haze rules have been included in
the table above. We are monitoring the status of other environmental matters, which, depending on their final outcome, could require modification to our
planned environmental expenditures.
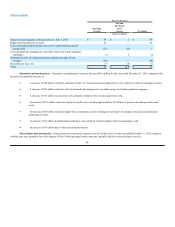
Distribution and transmission capital expenditures are comprised of infrastructure additions and upgrades, capital replacements, and new customer
construction. Examples of the types of projects included in the forecast include power lines, substations, and line extensions to new residential and
commercial developments.
Capital expenditures will be funded with internally generated cash and external financings, which may include issuances of long-term debt and
Pinnacle West common stock.
Financing Cash Flows and Liquidity
2013 Compared with 2012. Pinnacle West’s consolidated net cash used for financing activities was $161 million in 2013, compared to $305
million of net cash used in 2012, a decrease of $144
64