APS 2013 Annual Report Download - page 72
Download and view the complete annual report
Please find page 72 of the 2013 APS annual report below. You can navigate through the pages in the report by either clicking on the pages listed below, or by using the keyword search tool below to find specific information within the annual report.-
 1
1 -
2
-
3
-
4
-
5
-
6
-
7
-
8
-
9
-
10
-
11
-
12
-
13
-
14
-
15
-
16
-
17
-
18
-
19
-
20
-
21
-
22
-
23
-
24
-
25
-
26
-
27
-
28
-
29
-
30
-
31
-
32
-
33
-
34
-
35
-
36
-
37
-
38
-
39
-
40
-
41
-
42
-
43
-
44
-
45
-
46
-
47
-
48
-
49
-
50
-
51
-
52
-
53
-
54
-
55
-
56
-
57
-
58
-
59
-
60
-
61
-
 62
62 -
 63
63 -
 64
64 -
 65
65 -
 66
66 -
 67
67 -
 68
68 -
 69
69 -
 70
70 -
 71
71 -
 72
72 -
 73
73 -
 74
74 -
 75
75 -
 76
76 -
 77
77 -
 78
78 -
 79
79 -
 80
80 -
 81
81 -
 82
82 -
83
-
84
-
85
-
86
-
87
-
88
-
89
-
90
-
91
-
92
-
93
-
94
-
95
-
96
-
97
-
98
-
99
-
100
-
101
-
102
-
103
-
104
-
105
-
106
-
107
-
108
-
109
-
110
-
111
-
112
-
113
-
114
-
115
-
116
-
117
-
118
-
119
-
120
-
121
-
122
-
123
-
124
-
125
-
126
-
127
-
128
-
129
-
130
-
131
-
132
-
133
-
134
-
135
-
136
-
137
-
138
-
139
-
140
-
141
-
142
-
143
-
144
-
145
-
146
-
147
-
148
-
149
-
150
-
151
-
152
-
153
-
154
-
155
-
156
-
157
-
158
-
159
-
160
-
161
-
162
-
163
-
164
-
165
-
166
-
167
-
168
-
169
-
170
-
171
-
172
-
173
-
174
-
175
-
176
-
177
-
178
-
179
-
180
-
181
-
182
-
183
-
184
-
185
-
186
-
187
-
188
-
189
-
190
-
191
-
192
-
193
-
194
-
195
-
196
-
197
-
198
-
199
-
200
-
201
-
202
-
203
-
204
-
205
-
206
-
207
-
208
-
209
-
210
-
211
-
212
-
213
-
214
-
215
-
216
-
217
-
218
-
219
-
220
-
221
-
222
-
223
-
224
-
225
-
226
-
227
-
228
-
229
-
230
-
231
-
232
-
233
-
234
-
235
-
236
-
237
-
238
-
239
-
240
-
241
-
242
-
243
-
244
-
245
-
246
-
247
-
248
-
249
-
250
-
251
-
252
-
253
-
254
-
255
-
256
-
257
-
258
-
259
-
260
-
261
-
262
-
263
-
264
-
265
-
266
 |
 |

Table of Contents
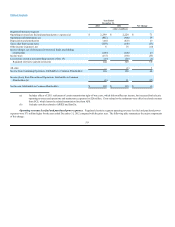
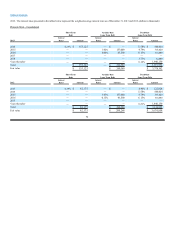
If we elect to extend the leases, we will be required to make annual payments beginning in 2016 of approximately $23 million; however, the
length of the lease extensions is unknown at this time as it must be determined through an appraisal process. Due to these uncertainties,
amounts relating to the noncontrolling interests beyond 2015 have not been included in the table above.
This table excludes $42 million in unrecognized tax benefits because the timing of the future cash outflows is uncertain. This table also excludes
approximately zero, $19 million and $122 million in estimated minimum pension contributions for 2014, 2015 and 2016, respectively (see Note 8).
CRITICAL ACCOUNTING POLICIES
In preparing the financial statements in accordance with accounting principles generally accepted in the United States of America (“GAAP”),
management must often make estimates and assumptions that affect the reported amounts of assets, liabilities, revenues, expenses and related disclosures at
the date of the financial statements and during the reporting period. Some of those judgments can be subjective and complex, and actual results could differ
from those estimates. We consider the following accounting policies to be our most critical because of the uncertainties, judgments and complexities of the
underlying accounting standards and operations involved.
Regulatory Accounting
Regulatory accounting allows for the actions of regulators, such as the ACC and FERC, to be reflected in our financial statements. Their actions
may cause us to capitalize costs that would otherwise be included as an expense in the current period by unregulated companies. Regulatory assets represent
incurred costs that have been deferred because they are probable of future recovery in customer rates. Regulatory liabilities generally represent expected future
costs that have already been collected from customers. Management continually assesses whether our regulatory assets are probable of future recovery by
considering factors such as applicable regulatory environment changes and recent rate orders to other regulated entities in the same jurisdiction. This
determination reflects the current political and regulatory climate in Arizona and is subject to change in the future. If future recovery of costs ceases to be
probable, the assets would be written off as a charge in current period earnings. We had $809 million of regulatory assets and $901 million of regulatory
liabilities on the Consolidated Balance Sheets at December 31, 2013.
Included in the balance of regulatory assets at December 31, 2013 is a regulatory asset of $314 million for pension and other postretirement benefits.
This regulatory asset represents the future recovery of these costs through retail rates as these amounts are charged to earnings. If these costs are disallowed by
the ACC, this regulatory asset would be charged to OCI and result in lower future earnings.
See Notes 1 and 3 for more information.
Pensions and Other Postretirement Benefit Accounting
Changes in our actuarial assumptions used in calculating our pension and other postretirement benefit liability and expense can have a significant
impact on our earnings and financial position. The most relevant actuarial assumptions are the discount rate used to measure our liability and net periodic
cost, the expected long-term rate of return on plan assets used to estimate earnings on invested funds
69