APS 2013 Annual Report Download - page 145
Download and view the complete annual report
Please find page 145 of the 2013 APS annual report below. You can navigate through the pages in the report by either clicking on the pages listed below, or by using the keyword search tool below to find specific information within the annual report.-
 1
1 -
2
-
3
-
4
-
5
-
6
-
7
-
8
-
9
-
10
-
11
-
12
-
13
-
14
-
15
-
16
-
17
-
18
-
19
-
20
-
21
-
22
-
23
-
24
-
25
-
26
-
27
-
28
-
29
-
30
-
31
-
32
-
33
-
34
-
35
-
36
-
37
-
38
-
39
-
40
-
41
-
42
-
43
-
44
-
45
-
46
-
47
-
48
-
49
-
50
-
51
-
52
-
53
-
54
-
55
-
56
-
57
-
58
-
59
-
60
-
61
-
62
-
63
-
64
-
65
-
66
-
67
-
68
-
69
-
70
-
71
-
72
-
73
-
74
-
75
-
76
-
77
-
78
-
79
-
80
-
81
-
82
-
83
-
84
-
85
-
86
-
87
-
88
-
89
-
90
-
91
-
92
-
93
-
94
-
95
-
96
-
97
-
98
-
99
-
100
-
101
-
102
-
103
-
104
-
105
-
106
-
107
-
108
-
109
-
110
-
111
-
112
-
113
-
114
-
115
-
116
-
117
-
118
-
119
-
120
-
121
-
122
-
123
-
124
-
125
-
126
-
127
-
128
-
129
-
130
-
131
-
132
-
133
-
134
-
 135
135 -
 136
136 -
 137
137 -
 138
138 -
 139
139 -
 140
140 -
 141
141 -
 142
142 -
 143
143 -
 144
144 -
 145
145 -
 146
146 -
 147
147 -
 148
148 -
 149
149 -
 150
150 -
 151
151 -
 152
152 -
 153
153 -
 154
154 -
 155
155 -
156
-
157
-
158
-
159
-
160
-
161
-
162
-
163
-
164
-
165
-
166
-
167
-
168
-
169
-
170
-
171
-
172
-
173
-
174
-
175
-
176
-
177
-
178
-
179
-
180
-
181
-
182
-
183
-
184
-
185
-
186
-
187
-
188
-
189
-
190
-
191
-
192
-
193
-
194
-
195
-
196
-
197
-
198
-
199
-
200
-
201
-
202
-
203
-
204
-
205
-
206
-
207
-
208
-
209
-
210
-
211
-
212
-
213
-
214
-
215
-
216
-
217
-
218
-
219
-
220
-
221
-
222
-
223
-
224
-
225
-
226
-
227
-
228
-
229
-
230
-
231
-
232
-
233
-
234
-
235
-
236
-
237
-
238
-
239
-
240
-
241
-
242
-
243
-
244
-
245
-
246
-
247
-
248
-
249
-
250
-
251
-
252
-
253
-
254
-
255
-
256
-
257
-
258
-
259
-
260
-
261
-
262
-
263
-
264
-
265
-
266
 |
 |

Table of Contents
PINNACLE WEST CAPITAL CORPORATION
NOTES TO CONSOLIDATED FINANCIAL STATEMENTS
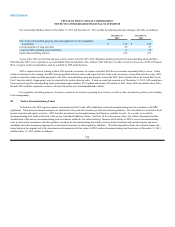
will proportionally vest on the same remaining vesting schedule that applies to the original restricted stock unit.
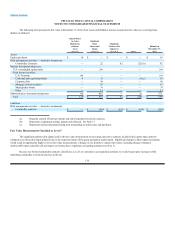
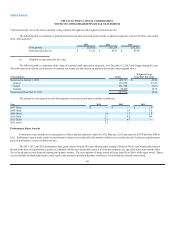
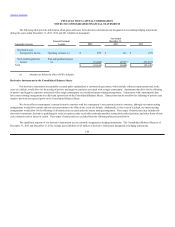
The following table is a summary of granted restricted stock units and stock grants and the weighted-average fair value for the three years ended
2013, 2012 and 2011:
2013 2012 2011
Units granted 129,620 202,278 292,242
Grant date fair value (a) $55.21 $49.31 $ 41.98
(a) Weighted-average grant date fair value.
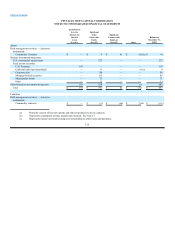
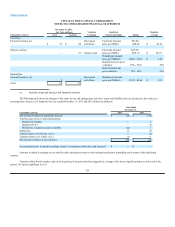
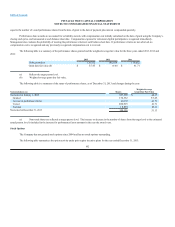
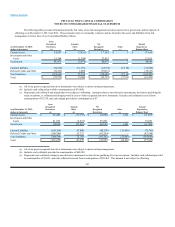
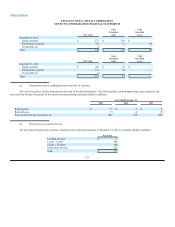
The following table is a summary of the status of restricted stock units and stock grants, as of December 31, 2013 and changes during the year.
This table represents only the stock portion of restricted stock units, per the election on payment discussed in the paragraph above:
Nonvested shares Shares
Weighted-Average
Grant Date Fair Value
Nonvested at January 1, 2013 480,753 $43.58
Granted 129,620 55.21
Vested 191,988 40.33
Forfeited 20,409 45.70
Nonvested at December 31, 2013 397,976 47.74
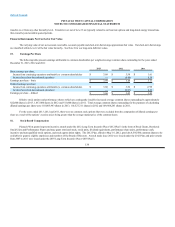
The amount of cash required to settle the payments on restricted stock units is (dollars in millions):
Year 2013 2012 2011
2007 Grant $ — $ — $ 1.0
2008 Grant —1.9 1.6
2009 Grant 3.0 1.7 1.5
2010 Grant 2.3 0.6 0.6
2011 Grant 2.5 0.7 —
2012 Grant 2.2 — —
Performance Share Awards
Performance share awards have been granted to officers and key employees under the 2012 Plan since 2012 and under the 2007 Plan from 2008 to
2011. Performance share awards contain two performance element criteria that affect the number of shares received after the end of a three-year performance
period if performance criteria conditions are met.
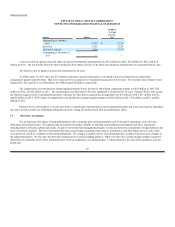
The 2013, 2012 and 2011 performance share grant criteria is based 50% upon the percentile ranking of Pinnacle West’s total shareholder return at
the end of the three-year performance period, as compared with the total shareholder return of all relevant companies in a specified utility index and the other
50% is based upon six non-financial separate performance metrics. The exact number of shares issued will vary from 0% to 200% of the target award. Shares
received include dividend rights paid in stock equal to the amount of dividends that they would have received had they directly owned stock,
141