APS 2013 Annual Report Download - page 173
Download and view the complete annual report
Please find page 173 of the 2013 APS annual report below. You can navigate through the pages in the report by either clicking on the pages listed below, or by using the keyword search tool below to find specific information within the annual report.-
 1
1 -
2
-
3
-
4
-
5
-
6
-
7
-
8
-
9
-
10
-
11
-
12
-
13
-
14
-
15
-
16
-
17
-
18
-
19
-
20
-
21
-
22
-
23
-
24
-
25
-
26
-
27
-
28
-
29
-
30
-
31
-
32
-
33
-
34
-
35
-
36
-
37
-
38
-
39
-
40
-
41
-
42
-
43
-
44
-
45
-
46
-
47
-
48
-
49
-
50
-
51
-
52
-
53
-
54
-
55
-
56
-
57
-
58
-
59
-
60
-
61
-
62
-
63
-
64
-
65
-
66
-
67
-
68
-
69
-
70
-
71
-
72
-
73
-
74
-
75
-
76
-
77
-
78
-
79
-
80
-
81
-
82
-
83
-
84
-
85
-
86
-
87
-
88
-
89
-
90
-
91
-
92
-
93
-
94
-
95
-
96
-
97
-
98
-
99
-
100
-
101
-
102
-
103
-
104
-
105
-
106
-
107
-
108
-
109
-
110
-
111
-
112
-
113
-
114
-
115
-
116
-
117
-
118
-
119
-
120
-
121
-
122
-
123
-
124
-
125
-
126
-
127
-
128
-
129
-
130
-
131
-
132
-
133
-
134
-
135
-
136
-
137
-
138
-
139
-
140
-
141
-
142
-
143
-
144
-
145
-
146
-
147
-
148
-
149
-
150
-
151
-
152
-
153
-
154
-
155
-
156
-
157
-
158
-
159
-
160
-
161
-
162
-
 163
163 -
 164
164 -
 165
165 -
 166
166 -
 167
167 -
 168
168 -
 169
169 -
 170
170 -
 171
171 -
 172
172 -
 173
173 -
 174
174 -
 175
175 -
 176
176 -
 177
177 -
 178
178 -
 179
179 -
 180
180 -
 181
181 -
 182
182 -
 183
183 -
184
-
185
-
186
-
187
-
188
-
189
-
190
-
191
-
192
-
193
-
194
-
195
-
196
-
197
-
198
-
199
-
200
-
201
-
202
-
203
-
204
-
205
-
206
-
207
-
208
-
209
-
210
-
211
-
212
-
213
-
214
-
215
-
216
-
217
-
218
-
219
-
220
-
221
-
222
-
223
-
224
-
225
-
226
-
227
-
228
-
229
-
230
-
231
-
232
-
233
-
234
-
235
-
236
-
237
-
238
-
239
-
240
-
241
-
242
-
243
-
244
-
245
-
246
-
247
-
248
-
249
-
250
-
251
-
252
-
253
-
254
-
255
-
256
-
257
-
258
-
259
-
260
-
261
-
262
-
263
-
264
-
265
-
266
 |
 |

Table of Contents
ARIZONA PUBLIC SERVICE COMPANY
NOTES TO CONSOLIDATED FINANCIAL STATEMENTS
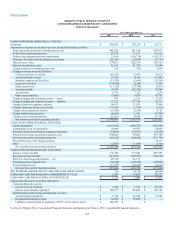
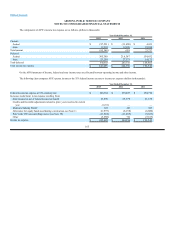
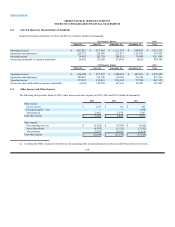
S-2. Selected Quarterly Financial Data (Unaudited)
Quarterly financial information for 2013 and 2012 is as follows (dollars in thousands):
2013 Quarter Ended, 2013
March 31, June 30, September 30, December 31, Total
Operating revenues $685,827 $915,065 $1,151,535 $698,824 $3,451,251
Operations and maintenance 220,752 224,950 222,617 229,505 897,824
Operating income 74,862 183,728 284,251 79,024 621,865
Net income attributable to common shareholder 26,042 133,949 234,954 30,024 424,969
2012 Quarter Ended, 2012
March 31, June 30, September 30, December 31, Total
Operating revenues $ 620,248 $ 877,587 $1,108,623 $ 687,031 $ 3,293,489
Operations and maintenance 208,447 213,746 218,403 233,320 873,916
Operating income 53,995 176,821 296,945 77,768 605,529
Net income (loss) attributable to common shareholder (4,105)124,928 247,831 26,843 395,497
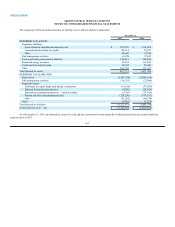
S-3. Other Income and Other Expense
The following table provides detail of APS’s other income and other expense for 2013, 2012 and 2011 (dollars in thousands):
2013 2012 2011
Other income:
Interest income $1,234 $310 $406
Investment gains — net — — 1,418
Miscellaneous 2,662 2,558 3,247
Total other income $3,896 $2,868 $5,071
Other expense:
Non-operating costs (a) $(9,626) $ (8,706) $ (8,810)
Asset dispositions (4,992)(1,511) (1,352)
Miscellaneous (5,831) (10,933)(5,166)
Total other expense $(20,449)$ (21,150)$ (15,328)
(a) As defined by FERC, includes below-the-line non-operating utility income and expense (items excluded from utility rate recovery).
168