APS 2013 Annual Report Download - page 124
Download and view the complete annual report
Please find page 124 of the 2013 APS annual report below. You can navigate through the pages in the report by either clicking on the pages listed below, or by using the keyword search tool below to find specific information within the annual report.-
 1
1 -
2
-
3
-
4
-
5
-
6
-
7
-
8
-
9
-
10
-
11
-
12
-
13
-
14
-
15
-
16
-
17
-
18
-
19
-
20
-
21
-
22
-
23
-
24
-
25
-
26
-
27
-
28
-
29
-
30
-
31
-
32
-
33
-
34
-
35
-
36
-
37
-
38
-
39
-
40
-
41
-
42
-
43
-
44
-
45
-
46
-
47
-
48
-
49
-
50
-
51
-
52
-
53
-
54
-
55
-
56
-
57
-
58
-
59
-
60
-
61
-
62
-
63
-
64
-
65
-
66
-
67
-
68
-
69
-
70
-
71
-
72
-
73
-
74
-
75
-
76
-
77
-
78
-
79
-
80
-
81
-
82
-
83
-
84
-
85
-
86
-
87
-
88
-
89
-
90
-
91
-
92
-
93
-
94
-
95
-
96
-
97
-
98
-
99
-
100
-
101
-
102
-
103
-
104
-
105
-
106
-
107
-
108
-
109
-
110
-
111
-
112
-
113
-
 114
114 -
 115
115 -
 116
116 -
 117
117 -
 118
118 -
 119
119 -
 120
120 -
 121
121 -
 122
122 -
 123
123 -
 124
124 -
 125
125 -
 126
126 -
 127
127 -
 128
128 -
 129
129 -
 130
130 -
 131
131 -
 132
132 -
 133
133 -
 134
134 -
135
-
136
-
137
-
138
-
139
-
140
-
141
-
142
-
143
-
144
-
145
-
146
-
147
-
148
-
149
-
150
-
151
-
152
-
153
-
154
-
155
-
156
-
157
-
158
-
159
-
160
-
161
-
162
-
163
-
164
-
165
-
166
-
167
-
168
-
169
-
170
-
171
-
172
-
173
-
174
-
175
-
176
-
177
-
178
-
179
-
180
-
181
-
182
-
183
-
184
-
185
-
186
-
187
-
188
-
189
-
190
-
191
-
192
-
193
-
194
-
195
-
196
-
197
-
198
-
199
-
200
-
201
-
202
-
203
-
204
-
205
-
206
-
207
-
208
-
209
-
210
-
211
-
212
-
213
-
214
-
215
-
216
-
217
-
218
-
219
-
220
-
221
-
222
-
223
-
224
-
225
-
226
-
227
-
228
-
229
-
230
-
231
-
232
-
233
-
234
-
235
-
236
-
237
-
238
-
239
-
240
-
241
-
242
-
243
-
244
-
245
-
246
-
247
-
248
-
249
-
250
-
251
-
252
-
253
-
254
-
255
-
256
-
257
-
258
-
259
-
260
-
261
-
262
-
263
-
264
-
265
-
266
 |
 |

Table of Contents
PINNACLE WEST CAPITAL CORPORATION
NOTES TO CONSOLIDATED FINANCIAL STATEMENTS
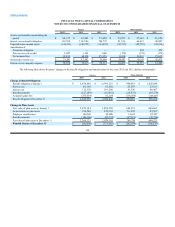
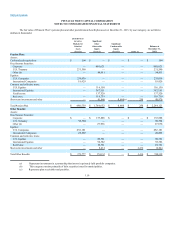
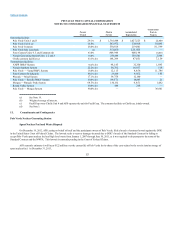
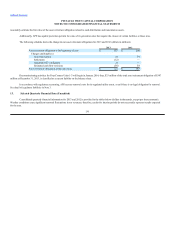
The fair value of Pinnacle West’s pension plan and other postretirement benefit plan assets at December 31, 2012, by asset category, are as follows
(dollars in thousands):
Quoted Prices
in Active
Markets for
Identical
Assets
(Level 1)
Significant
Other
Observable
Inputs
(Level 2)
Significant
Unobservable
Inputs
(Level 3) Other (c)
Balance at
December 31,
2012
Pension Plan:
Assets:
Cash and cash equivalents $579 $ — $ — $ — $ 579
Fixed Income Securities:
Corporate —607,749 — — 607,749
U.S. Treasury 232,161 — — — 232,161
Other (b) —67,992 — — 67,992
Equities:
U.S. Companies 531,291 — — — 531,291
International Companies 43,848 — — — 43,848
Common and collective trusts:
U.S. Equities —176,694 — — 176,694
International Equities —271,735 — — 271,735
Real estate —117,854 — — 117,854
Short-term investments and other —26,922 2,419(a) (63)29,278
Total Pension Plan $807,879 $1,268,946 $2,419 $(63) $ 2,079,181
Other Benefits:
Assets:
Cash and cash equivalents $ 60 $ — $ — $ — $ 60
Fixed Income Securities:
Corporate — 163,306 — — 163,306
U.S. Treasury 112,558 — — — 112,558
Other (b) —33,998 — — 33,998
Equities:
U.S. Companies 205,714 — — — 205,714
International Companies 14,412 — — — 14,412
Common and collective trusts:
U.S. Equities —60,038 — — 60,038
International Equities —76,969 — — 76,969
Real Estate —9,378 — — 9,378
Short-term investments and other 402 6,340 — 1,046 7,788
Total Other Benefits $333,146 $ 350,029 $ — $ 1,046 $ 684,221
(a) Represents investments in a partnership that invests in privately held portfolio companies.
(b) This category consists primarily of debt securities issued by municipalities.
(c) Represents plan receivables and payables.
120