APS 2013 Annual Report Download - page 64
Download and view the complete annual report
Please find page 64 of the 2013 APS annual report below. You can navigate through the pages in the report by either clicking on the pages listed below, or by using the keyword search tool below to find specific information within the annual report.-
 1
1 -
2
-
3
-
4
-
5
-
6
-
7
-
8
-
9
-
10
-
11
-
12
-
13
-
14
-
15
-
16
-
17
-
18
-
19
-
20
-
21
-
22
-
23
-
24
-
25
-
26
-
27
-
28
-
29
-
30
-
31
-
32
-
33
-
34
-
35
-
36
-
37
-
38
-
39
-
40
-
41
-
42
-
43
-
44
-
45
-
46
-
47
-
48
-
49
-
50
-
51
-
52
-
53
-
 54
54 -
 55
55 -
 56
56 -
 57
57 -
 58
58 -
 59
59 -
 60
60 -
 61
61 -
 62
62 -
 63
63 -
 64
64 -
 65
65 -
 66
66 -
 67
67 -
 68
68 -
 69
69 -
 70
70 -
 71
71 -
 72
72 -
 73
73 -
 74
74 -
75
-
76
-
77
-
78
-
79
-
80
-
81
-
82
-
83
-
84
-
85
-
86
-
87
-
88
-
89
-
90
-
91
-
92
-
93
-
94
-
95
-
96
-
97
-
98
-
99
-
100
-
101
-
102
-
103
-
104
-
105
-
106
-
107
-
108
-
109
-
110
-
111
-
112
-
113
-
114
-
115
-
116
-
117
-
118
-
119
-
120
-
121
-
122
-
123
-
124
-
125
-
126
-
127
-
128
-
129
-
130
-
131
-
132
-
133
-
134
-
135
-
136
-
137
-
138
-
139
-
140
-
141
-
142
-
143
-
144
-
145
-
146
-
147
-
148
-
149
-
150
-
151
-
152
-
153
-
154
-
155
-
156
-
157
-
158
-
159
-
160
-
161
-
162
-
163
-
164
-
165
-
166
-
167
-
168
-
169
-
170
-
171
-
172
-
173
-
174
-
175
-
176
-
177
-
178
-
179
-
180
-
181
-
182
-
183
-
184
-
185
-
186
-
187
-
188
-
189
-
190
-
191
-
192
-
193
-
194
-
195
-
196
-
197
-
198
-
199
-
200
-
201
-
202
-
203
-
204
-
205
-
206
-
207
-
208
-
209
-
210
-
211
-
212
-
213
-
214
-
215
-
216
-
217
-
218
-
219
-
220
-
221
-
222
-
223
-
224
-
225
-
226
-
227
-
228
-
229
-
230
-
231
-
232
-
233
-
234
-
235
-
236
-
237
-
238
-
239
-
240
-
241
-
242
-
243
-
244
-
245
-
246
-
247
-
248
-
249
-
250
-
251
-
252
-
253
-
254
-
255
-
256
-
257
-
258
-
259
-
260
-
261
-
262
-
263
-
264
-
265
-
266
 |
 |

Table of Contents
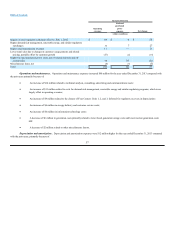
Taxes other than income taxes. Taxes other than income taxes increased $11 million for the year ended December 31, 2012 compared with the
prior year, primarily because of higher property tax rates in the current year.
Other income (expenses), net. Other income (expenses), net, decreased $10 million for the year ended December 31, 2012 compared with the prior
year, primarily because of higher investment losses of approximately $2 million and other non-operating expenses of approximately $8 million in the current
year.
Interest charges, net of allowance for borrowed funds used during construction. Interest charges, net of allowance for borrowed funds used
during construction, decreased $24 million for the year ended December 31, 2012 compared with the prior year, primarily because of lower debt balances and
lower interest rates in the current year.
Income taxes. Income taxes were $53 million higher for the year ended December 31, 2012 compared with the prior year, primarily due to higher
pre-tax income in the current year and a lower effective tax rate in 2011.
Discontinued Operations
Results from discontinued operations decreased $17 million, primarily due to a contribution Pinnacle West made to SunCor’s estate as part of a
negotiated resolution to the bankruptcy (see Note 1) and absence of a gain related to the sale of our investment in APSES in 2011.
LIQUIDITY AND CAPITAL RESOURCES
Overview
Pinnacle West’s primary cash needs are for dividends to our shareholders and principal and interest payments on our indebtedness. The level of our
common stock dividends and future dividend growth will be dependent on declaration by our Board of Directors and based on a number of factors, including
our financial condition, payout ratio, free cash flow and other factors.
Our primary sources of cash are dividends from APS and external debt and equity issuances. An ACC order requires APS to maintain a common
equity ratio of at least 40%. As defined in the ACC order, the common equity ratio is total shareholder equity divided by the sum of total shareholder equity
and long-term debt, including current maturities of long-term debt. At December 31, 2013, APS’s common equity ratio, as defined, was 58%. Its total
shareholder equity was approximately $4.3 billion, and total capitalization was approximately $7.5 billion. Under this order, APS would be prohibited from
paying dividends if such payment would reduce its total shareholder equity below approximately $3.0 billion, assuming APS’s total capitalization remains the
same. This restriction does not materially affect Pinnacle West’s ability to meet its ongoing cash needs or ability to pay dividends to shareholders.
APS’s capital requirements consist primarily of capital expenditures and maturities of long-term debt. APS funds its capital requirements with cash
from operations and, to the extent necessary, external debt financing and equity infusions from Pinnacle West.
61