APS 2013 Annual Report Download - page 120
Download and view the complete annual report
Please find page 120 of the 2013 APS annual report below. You can navigate through the pages in the report by either clicking on the pages listed below, or by using the keyword search tool below to find specific information within the annual report.-
 1
1 -
2
-
3
-
4
-
5
-
6
-
7
-
8
-
9
-
10
-
11
-
12
-
13
-
14
-
15
-
16
-
17
-
18
-
19
-
20
-
21
-
22
-
23
-
24
-
25
-
26
-
27
-
28
-
29
-
30
-
31
-
32
-
33
-
34
-
35
-
36
-
37
-
38
-
39
-
40
-
41
-
42
-
43
-
44
-
45
-
46
-
47
-
48
-
49
-
50
-
51
-
52
-
53
-
54
-
55
-
56
-
57
-
58
-
59
-
60
-
61
-
62
-
63
-
64
-
65
-
66
-
67
-
68
-
69
-
70
-
71
-
72
-
73
-
74
-
75
-
76
-
77
-
78
-
79
-
80
-
81
-
82
-
83
-
84
-
85
-
86
-
87
-
88
-
89
-
90
-
91
-
92
-
93
-
94
-
95
-
96
-
97
-
98
-
99
-
100
-
101
-
102
-
103
-
104
-
105
-
106
-
107
-
108
-
109
-
 110
110 -
 111
111 -
 112
112 -
 113
113 -
 114
114 -
 115
115 -
 116
116 -
 117
117 -
 118
118 -
 119
119 -
 120
120 -
 121
121 -
 122
122 -
 123
123 -
 124
124 -
 125
125 -
 126
126 -
 127
127 -
 128
128 -
 129
129 -
 130
130 -
131
-
132
-
133
-
134
-
135
-
136
-
137
-
138
-
139
-
140
-
141
-
142
-
143
-
144
-
145
-
146
-
147
-
148
-
149
-
150
-
151
-
152
-
153
-
154
-
155
-
156
-
157
-
158
-
159
-
160
-
161
-
162
-
163
-
164
-
165
-
166
-
167
-
168
-
169
-
170
-
171
-
172
-
173
-
174
-
175
-
176
-
177
-
178
-
179
-
180
-
181
-
182
-
183
-
184
-
185
-
186
-
187
-
188
-
189
-
190
-
191
-
192
-
193
-
194
-
195
-
196
-
197
-
198
-
199
-
200
-
201
-
202
-
203
-
204
-
205
-
206
-
207
-
208
-
209
-
210
-
211
-
212
-
213
-
214
-
215
-
216
-
217
-
218
-
219
-
220
-
221
-
222
-
223
-
224
-
225
-
226
-
227
-
228
-
229
-
230
-
231
-
232
-
233
-
234
-
235
-
236
-
237
-
238
-
239
-
240
-
241
-
242
-
243
-
244
-
245
-
246
-
247
-
248
-
249
-
250
-
251
-
252
-
253
-
254
-
255
-
256
-
257
-
258
-
259
-
260
-
261
-
262
-
263
-
264
-
265
-
266
 |
 |

Table of Contents
PINNACLE WEST CAPITAL CORPORATION
NOTES TO CONSOLIDATED FINANCIAL STATEMENTS
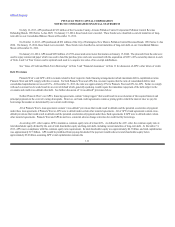
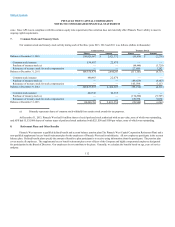
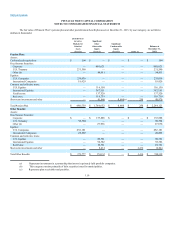
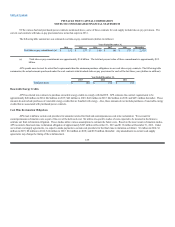
The following table shows the weighted-average assumptions used for both the pension and other benefits to determine benefit obligations and net
periodic benefit costs:
Benefit Obligations
As of December 31,
Benefit Costs
For the Years Ended December 31,
2013 2012 2013 2012 2011
Discount rate – pension 4.88%4.01%4.01%4.42%5.31%
Discount rate – other benefits 5.10%4.20%4.20%4.59%5.49%
Rate of compensation increase 4.00%4.00%4.00%4.00%4.00%
Expected long-term return on plan assets N/A N/A 7.00%7.75%7.75%
Initial healthcare cost trend rate 7.50%7.50%7.50%7.50%8.00%
Ultimate healthcare cost trend rate 5.00%5.00%5.00%5.00%5.00%
Number of years to ultimate trend rate 4 4 4 4 4
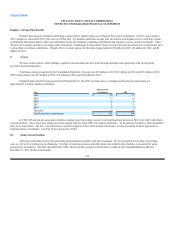
In selecting the pretax expected long-term rate of return on plan assets, we consider past performance and economic forecasts for the types of
investments held by the plan. For 2014, we are assuming a 6.9% long-term rate of return for pension assets and 7.1% (before tax) for other benefit assets,
which we believe is reasonable given our asset allocation in relation to historical and expected performance.
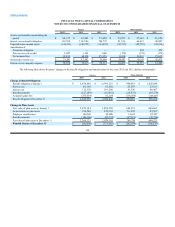
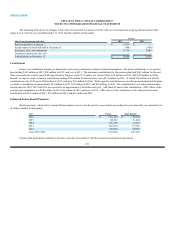
The assumed healthcare cost trend rates shown above have a significant effect on the amounts reported for the healthcare plans. In selecting our
healthcare trend rates, we consider past performance and forecasts of healthcare costs. A one percentage point change in the assumed initial and ultimate
healthcare cost trend rates would have the following effects (dollars in millions):
1% Increase 1% Decrease
Effect on other postretirement benefits expense, after consideration of amounts capitalized or billed to
electric plant participants $13 $(10)
Effect on service and interest cost components of net periodic other postretirement benefit costs 14 (11)
Effect on the accumulated other postretirement benefit obligation 149 (120)
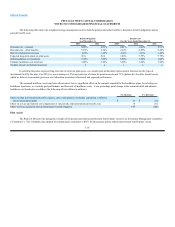
Plan Assets
The Board of Directors has delegated oversight of the pension and other postretirement benefit plans’ assets to an Investment Management Committee
(“Committee”). The Committee has adopted investment policy statements (“IPS”) for the pension and the other postretirement benefit plans’ assets.
116