APS 2013 Annual Report Download - page 135
Download and view the complete annual report
Please find page 135 of the 2013 APS annual report below. You can navigate through the pages in the report by either clicking on the pages listed below, or by using the keyword search tool below to find specific information within the annual report.-
 1
1 -
2
-
3
-
4
-
5
-
6
-
7
-
8
-
9
-
10
-
11
-
12
-
13
-
14
-
15
-
16
-
17
-
18
-
19
-
20
-
21
-
22
-
23
-
24
-
25
-
26
-
27
-
28
-
29
-
30
-
31
-
32
-
33
-
34
-
35
-
36
-
37
-
38
-
39
-
40
-
41
-
42
-
43
-
44
-
45
-
46
-
47
-
48
-
49
-
50
-
51
-
52
-
53
-
54
-
55
-
56
-
57
-
58
-
59
-
60
-
61
-
62
-
63
-
64
-
65
-
66
-
67
-
68
-
69
-
70
-
71
-
72
-
73
-
74
-
75
-
76
-
77
-
78
-
79
-
80
-
81
-
82
-
83
-
84
-
85
-
86
-
87
-
88
-
89
-
90
-
91
-
92
-
93
-
94
-
95
-
96
-
97
-
98
-
99
-
100
-
101
-
102
-
103
-
104
-
105
-
106
-
107
-
108
-
109
-
110
-
111
-
112
-
113
-
114
-
115
-
116
-
117
-
118
-
119
-
120
-
121
-
122
-
123
-
124
-
 125
125 -
 126
126 -
 127
127 -
 128
128 -
 129
129 -
 130
130 -
 131
131 -
 132
132 -
 133
133 -
 134
134 -
 135
135 -
 136
136 -
 137
137 -
 138
138 -
 139
139 -
 140
140 -
 141
141 -
 142
142 -
 143
143 -
 144
144 -
 145
145 -
146
-
147
-
148
-
149
-
150
-
151
-
152
-
153
-
154
-
155
-
156
-
157
-
158
-
159
-
160
-
161
-
162
-
163
-
164
-
165
-
166
-
167
-
168
-
169
-
170
-
171
-
172
-
173
-
174
-
175
-
176
-
177
-
178
-
179
-
180
-
181
-
182
-
183
-
184
-
185
-
186
-
187
-
188
-
189
-
190
-
191
-
192
-
193
-
194
-
195
-
196
-
197
-
198
-
199
-
200
-
201
-
202
-
203
-
204
-
205
-
206
-
207
-
208
-
209
-
210
-
211
-
212
-
213
-
214
-
215
-
216
-
217
-
218
-
219
-
220
-
221
-
222
-
223
-
224
-
225
-
226
-
227
-
228
-
229
-
230
-
231
-
232
-
233
-
234
-
235
-
236
-
237
-
238
-
239
-
240
-
241
-
242
-
243
-
244
-
245
-
246
-
247
-
248
-
249
-
250
-
251
-
252
-
253
-
254
-
255
-
256
-
257
-
258
-
259
-
260
-
261
-
262
-
263
-
264
-
265
-
266
 |
 |

Table of Contents
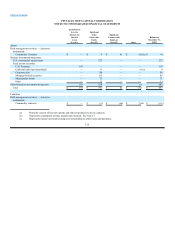
PINNACLE WEST CAPITAL CORPORATION
NOTES TO CONSOLIDATED FINANCIAL STATEMENTS
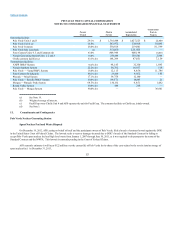
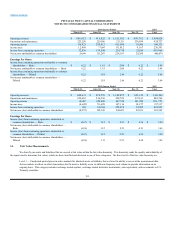
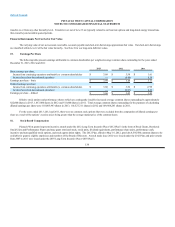
2013 Quarter Ended 2013
March 31, June 30, Sept. 30, Dec. 31, Total
Operating revenues $686,652 $915,822 $1,152,392 $699,762 $3,454,628
Operations and maintenance 223,250 229,300 233,323 238,854 924,727
Operating income 86,923 259,812 415,688 83,900 846,323
Income taxes 12,469 77,043 131,912 9,167 230,591
Income from continuing operations 32,836 139,598 234,718 32,814 439,966
Net income attributable to common shareholders 24,444 131,207 226,163 24,260 406,074
Earnings Per Share:
Income from continuing operations attributable to common
shareholders — Basic $0.22 $1.19 $ 2.06 $ 0.22 $3.69
Net income attributable to common shareholders — Basic 0.22 1.19 2.06 0.22 3.69
Income from continuing operations attributable to common
shareholders — Diluted 0.22 1.18 2.04 0.22 3.66
Net income attributable to common shareholders —
Diluted 0.22 1.18 2.04 0.22 3.66
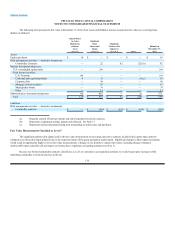
2012 Quarter Ended 2012
March 31, June 30, Sept. 30, Dec. 31, Total
Operating revenues $620,631 $878,576 $1,109,475 $693,122 $3,301,804
Operations and maintenance 210,663 216,236 220,729 237,141 884,769
Operating income 48,007 254,489 447,970 101,289 851,755
Income taxes (4,645) 76,689 147,116 18,157 237,317
Income from continuing operations 284 130,930 252,874 34,905 418,993
Net income (loss) attributable to common shareholders (8,257) 122,345 244,823 22,631 381,542
Earnings Per Share:
Income (loss) from continuing operations attributable to
common shareholders — Basic $(0.07) $ 1.12 $ 2.23 $0.24 $3.54
Net income (loss) attributable to common shareholders —
Basic (0.08) 1.12 2.23 0.21 3.48
Income (loss) from continuing operations attributable to
common shareholders — Diluted (0.07) 1.12 2.21 0.24 3.50
Net income (loss) attributable to common shareholders —
Diluted (0.08)1.11 2.21 0.20 3.45
14. Fair Value Measurements
We classify our assets and liabilities that are carried at fair value within the fair value hierarchy. This hierarchy ranks the quality and reliability of
the inputs used to determine fair values, which are then classified and disclosed in one of three categories. The three levels of the fair value hierarchy are:
Level 1 — Unadjusted quoted prices in active markets for identical assets or liabilities that we have the ability to access at the measurement date.
Active markets are those in which transactions for the asset or liability occur in sufficient frequency and volume to provide information on an
ongoing basis. This category includes exchange traded equities, exchange traded derivative instruments, cash equivalents, and investments in U.S.
Treasury securities.
131