APS 2013 Annual Report Download - page 118
Download and view the complete annual report
Please find page 118 of the 2013 APS annual report below. You can navigate through the pages in the report by either clicking on the pages listed below, or by using the keyword search tool below to find specific information within the annual report.-
 1
1 -
2
-
3
-
4
-
5
-
6
-
7
-
8
-
9
-
10
-
11
-
12
-
13
-
14
-
15
-
16
-
17
-
18
-
19
-
20
-
21
-
22
-
23
-
24
-
25
-
26
-
27
-
28
-
29
-
30
-
31
-
32
-
33
-
34
-
35
-
36
-
37
-
38
-
39
-
40
-
41
-
42
-
43
-
44
-
45
-
46
-
47
-
48
-
49
-
50
-
51
-
52
-
53
-
54
-
55
-
56
-
57
-
58
-
59
-
60
-
61
-
62
-
63
-
64
-
65
-
66
-
67
-
68
-
69
-
70
-
71
-
72
-
73
-
74
-
75
-
76
-
77
-
78
-
79
-
80
-
81
-
82
-
83
-
84
-
85
-
86
-
87
-
88
-
89
-
90
-
91
-
92
-
93
-
94
-
95
-
96
-
97
-
98
-
99
-
100
-
101
-
102
-
103
-
104
-
105
-
106
-
107
-
 108
108 -
 109
109 -
 110
110 -
 111
111 -
 112
112 -
 113
113 -
 114
114 -
 115
115 -
 116
116 -
 117
117 -
 118
118 -
 119
119 -
 120
120 -
 121
121 -
 122
122 -
 123
123 -
 124
124 -
 125
125 -
 126
126 -
 127
127 -
 128
128 -
129
-
130
-
131
-
132
-
133
-
134
-
135
-
136
-
137
-
138
-
139
-
140
-
141
-
142
-
143
-
144
-
145
-
146
-
147
-
148
-
149
-
150
-
151
-
152
-
153
-
154
-
155
-
156
-
157
-
158
-
159
-
160
-
161
-
162
-
163
-
164
-
165
-
166
-
167
-
168
-
169
-
170
-
171
-
172
-
173
-
174
-
175
-
176
-
177
-
178
-
179
-
180
-
181
-
182
-
183
-
184
-
185
-
186
-
187
-
188
-
189
-
190
-
191
-
192
-
193
-
194
-
195
-
196
-
197
-
198
-
199
-
200
-
201
-
202
-
203
-
204
-
205
-
206
-
207
-
208
-
209
-
210
-
211
-
212
-
213
-
214
-
215
-
216
-
217
-
218
-
219
-
220
-
221
-
222
-
223
-
224
-
225
-
226
-
227
-
228
-
229
-
230
-
231
-
232
-
233
-
234
-
235
-
236
-
237
-
238
-
239
-
240
-
241
-
242
-
243
-
244
-
245
-
246
-
247
-
248
-
249
-
250
-
251
-
252
-
253
-
254
-
255
-
256
-
257
-
258
-
259
-
260
-
261
-
262
-
263
-
264
-
265
-
266
 |
 |

Table of Contents
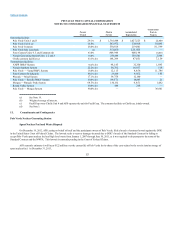
PINNACLE WEST CAPITAL CORPORATION
NOTES TO CONSOLIDATED FINANCIAL STATEMENTS
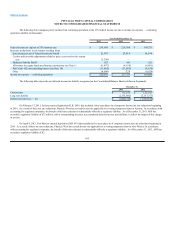
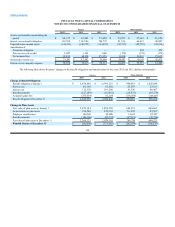
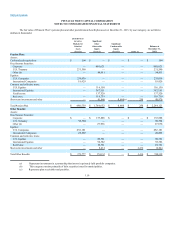
Pension Other Benefits
2013 2012 2011 2013 2012 2011
Service cost-benefits earned during the
period $64,195 $63,502 $57,605 $23,597 $27,163 $21,856
Interest cost on benefit obligation 112,392 119,586 124,727 41,536 46,467 46,807
Expected return on plan assets (146,333) (140,979) (133,678) (45,717) (45,793) (41,536)
Amortization of:
Transition obligation — — — — 452 452
Prior service cost (credit) 1,097 1,143 1,400 (179) (179) (179)
Net actuarial loss 39,852 44,250 25,956 11,310 20,233 15,015
Net periodic benefit cost $71,203 $87,502 $ 76,010 $ 30,547 $48,343 $ 42,415
Portion of cost charged to expense $38,968 $36,333 $29,312 $18,469 $19,321 $15,208
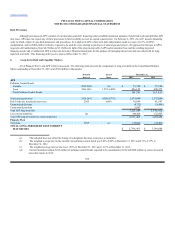
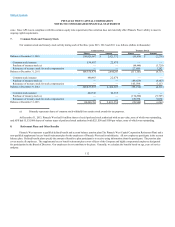
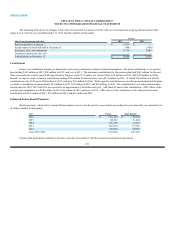
The following table shows the plans’ changes in the benefit obligations and funded status for the years 2013 and 2012 (dollars in thousands):
Pension Other Benefits
2013 2012 2013 2012
Change in Benefit Obligation
Benefit obligation at January 1 $2,850,846 $2,699,126 $990,418 $1,047,094
Service cost 64,195 63,502 23,597 27,163
Interest cost 112,392 119,586 41,536 46,467
Benefit payments (125,269)(113,632)(26,675)(26,279)
Actuarial (gain) loss (255,634)82,264 (138,458)(104,027)
Benefit obligation at December 31 2,646,530 2,850,846 890,418 990,418
Change in Plan Assets
Fair value of plan assets at January 1 2,079,181 1,850,550 684,221 608,663
Actual return on plan assets 150,546 259,363 76,995 83,567
Employer contributions 140,500 65,000 14,438 22,707
Benefit payments (106,106) (95,732) (27,315) (30,716)
Fair value of plan assets at December 31 2,264,121 2,079,181 748,339 684,221
Funded Status at December 31 $(382,409)$(771,665)$(142,079)$ (306,197)
114